Some of it – but some indications are that it’s not the majority.
Let’s define the trade balance in NIPA terms, so we look at “net exports”, in this case normalized by GDP.
![]()
Where ex is exports, im is imports.
Assume US exports depend on foreign economic activity, imports on US economic activity. This assume that imports are largely not substitutable for exports, and exports are not very substitutable for domestic use goods.
![]()
![]()
Where y is GDP, q is the trade weighted real exchange rate, defined as real $/real foreign currency unit.
This specification implicitly assumes perfect supply elasticity for exports, and for imports. This seems counterintuitive, but I haven’t found evidence for a time series effect (see this paper). Hence, in my research, I focus on the variations of the above specification [1], [2].
Take the total differential:
![]()
Since the Kopits’ focus is on non-oil goods trade balance, define each of the export and import terms accordingly. Then the change in US net exports of goods ex-oil as a share of US GDP can be decomposed into, on the one hand, an exogenous change in RoW autonomous demand for US goods exports, change associated with the change in RoW GDP, change associated with the change in the real exchange rate, an exogenous change in US autonomous demand for imports from the RoW, change associated with the change in US GDP, change associated with the change in the real exchange rate.
Mr. Kopits makes the assertion that the stimulus is the source of the trade deficit worsening, and the several fiscal packages that have been passed likely increased imports relative to what they otherwise would have been. But certainly the change in autonomous imports (as the pandemic switches consumption preferences toward goods and away from services) has an impact, perhaps as much an impact as the government spending and transfers that increase US personal income. However, as the decomposition makes clear, the decline in RoW GDP also affects the trade balance (as do changes in the real exchange rate – although the trade weighted real dollar is about the same as it was in February 2020).
I’m looking only at this sector, but considering developments in a larger Mundell-Fleming model would not change the conclusions.
One could argue that exports to the rest-of-the-world have been constrained by supply chain issues (or bizarrely, by loss of jobs per Mr. Kopits – so the stimulus caused people to lose jobs so exports couldn’t be produced?). I don’t think there has been much argument that this is a major issue.
Hence, it makes sense to look at the goods imports scaled by nominal GDP. That is shown in Figure 1.
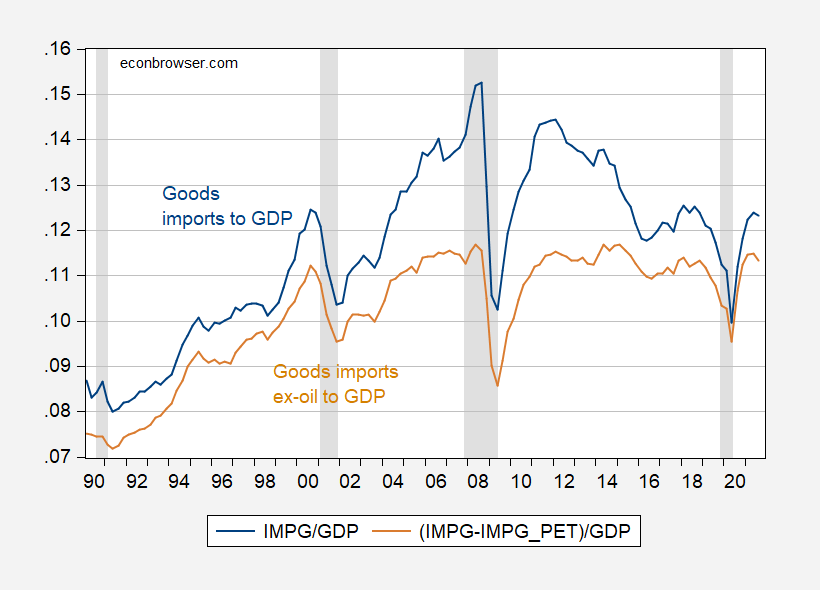
Figure 1: Imports of goods and services (in balance of payments terms) as a share of GDP (blue line), goods imports ex-petroleum (tan line). NBER recession dates peak-to-trough shaded gray. Source: BEA, NBER, and author’s calculations.
Now, it i2 true that the various packages starting in 2020 have supported consumption; but we would have had a switch toward goods even in the absence of these packages given the public health conditions. Thus, the question is how much of the elevated goods imports is due to the stimulus per se, rather than pandemic conditions.
As it turns out, over the last year up to 2021Q3, goods consumption rose 683 billion Ch12$ relative to 2019Q4 levels, while nonoil goods imports rose 227 billion Ch12$ (since 2019Q4, the average has been 62 billion Ch12$). So, over the past year, about 1/3 of goods consumption (ex-oil) has been accounted for by elevated levels of goods imports (ex-oil), part of which is due to the various recovery packages that have been passed since the pandemic struck.
However, because exports respond mostly to rest-of-world economic activity and the real exchange rate at the business cycle frequency, then the trade balance deterioration (and recent recovery) cannot be wholly attributed to the stimulus, particularly given the less stimulative fiscal policies pursued in many of our trading partner economies.
As a side point, it’s interesting to see how far for instance Long Beach TEU traffic has deviated from trend, as noted in this post, not much for imports. But a lot for exports.
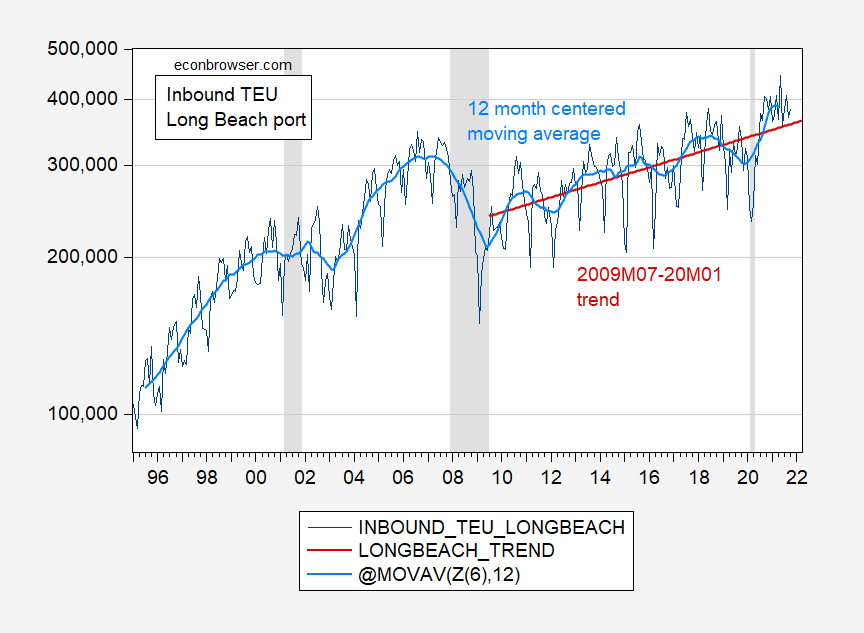
Figure 1: Inbound TEU’s, Port of Long Beach (dark blue), 12 month centered moving average (sky blue), and 2009M07-20M01 trend (red). NBER defined recession dates peak-trough shaded gray. TEU = twenty foot equivalent unit. Source: Port of Long Beach, NBER, and author’s calculations.
Inbound traffic is above trend, at least as measured by 12 month centered moving average. This is consistent with the view that elevated goods demand is driving some of the logistical issues currently being experienced.
One interesting aspect of the series is that it started declining substantially even before the pandemic struck. That in turn is consistent with tariffs biting on imports, or decelerating growth. On the other hand, outbound traffic has been off-trend for years.
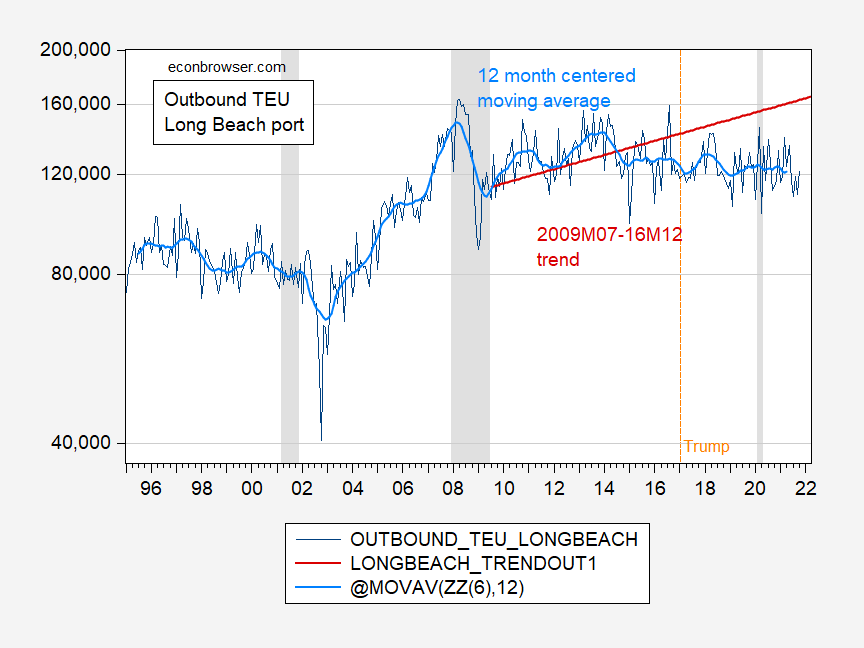
Figure 2: Outbound TEU’s, Port of Long Beach (dark blue), 12 month centered moving average (sky blue), and 2009M07-16M12 trend (red). NBER defined recession dates peak-trough shaded gray. TEU = twenty foot equivalent unit. Source: Port of Long Beach, NBER, and author’s calculations.
“One could argue that exports to the rest-of-the-world have been constrained by supply chain issues (or bizarrely, by loss of jobs per Mr. Kopits – so the stimulus caused people to lose jobs so exports couldn’t be produced?). I don’t think there has been much argument that this is a major issue.”
In a dizzying parade of weird if nonsensical statements, this one certainly stood out. We asked him to clarify WTF he meant here. Of course he was too busy writing even more bizarre claims to even once address this. No – he just kept repeating the same bizarro line over and over.
“it makes sense to look at the goods imports scaled by nominal GDP. That is shown in Figure 1.”
Comparing now to 2010, goods imports/GDP are lower not higher as Princeton Steve would have us believe. OK take oil out as your graph shows, the goods ex-oil import/GDP ratio is about the same as it was in 2010. So looking at this graph – WTF is Princeton Steve babbling about?
I think you earlier tried to make this point to Stevie but as usual – he did not listen.
Crude oil imports rose 39.4% in nominal terms in the first nine months of the year, adding 10% to total merchandise imports. The contribution was nearly twice as important (10%, and 13.5% if petroleum products are added in) as the second contributor, vehicle parts and accessories (up 21.9%, and adding 5.1% to the total).
The only other items to add at least 3% to the rise in imports were these:
* Cell phones and other household goods (4.3%, up 18.6% from Jan-Sep 2020)
* Toys, games, and sporting goods (3.8%, up 33.8%)
* Electric apparatus (3.2%, up 23.6%)
And, of course, “Other goods, n.e.c.” (3.1%, up 12.9%).
In nominal terms, the rise in oil imports added just 1% to the rise in total (merchandise) imports.
There’s a feeling I often get when reading authors who write mostly outside my areas of knowledge, but who wander into my areas and get things wrong. The feeling is “Why should I trust this guy to inform me about things I don’t understand, when I know (s)he is confidently wrong about stuff I do understand?”
I am assured by friends and colleagues that they often have the same question.
I have often had a feeling about consulting. The feeling is that there are a lot of bottom-feeders in the business. It’s easy to see why that would be true. Clients are consumers of the consultant’s specialty, not specialists themselves. Speaking consultant-speak with supreme confidence is pretty persuasive. (Don’t ask me how I know.) Consultants also face pressure to seem expert outside their area of specialty; clients pay for answers, so give them answers. The trick is, never let ’em know you’re a bottom-feeder.
So it’s a little surprising that Stevie is willing to prance around in the Emperor’s New Clothes here. Menzie does this macro stuff for a living. Stevie is a consultant. Not the same thing. Why risk making fundamental analytical errors where such errors are likely to be caught, especially when nobody is paying you? Ego, maybe? Political bias, maybe? Koch brothers are clients, maybe?
I’m not Stevie’s client, so I don’t know, but maybe Stevie already made this mistake in front of clients and became confident in the mistake as a result. Maybe it’s just a Dunning-Kruger kind of thing.
“Why risk making fundamental analytical errors where such errors are likely to be caught, especially when nobody is paying you? Ego, maybe? Political bias, maybe?”
Stevie brags about getting invited onto Fox and Friends – where he gets to spread his usual anti-immigrant bias to the adoration of the racist audience.
There has long been a sort of crude assumption in discussions of trade that the fiscal deficit drives the trade deficit. One heard it implied in the expression “twin deficits” starting in Reagan’s time. Problem is, that crude assumption leaves out private saving. Net national saving, not government saving, is the driver of the trade balance in this identity. Stevie was leaving out private saving, which has been through quite a swing in plague times.
There is also no one-for-one link between net saving and trade though they move together pretty consistently:
https://fred.stlouisfed.org/graph/?g=JWRw
Interesting.
FDIC [Quarterly Bank Profile] Aggregate Bank Deposits rose to $18.5T (1Q2021) up $2.7T, 17%, from 1Q2020 at $15.8T. Rose slightly to $18.7T (2Q2021); and to $19.1T +$436B or 2.3% in 3Q2021; that is up $3.3T, 21%, from 1Q2020.
Does finance both dwarf and determine real goods flows? Are you myopically mired in the minutae of noise, willfully ignoring gross finance capital flows, where 90% of the money is?
Yes, only partly and no. Which for you is pretty good.
Why would you even think to present that in log terms? Totally deceptive. Do the graphs straight up.
Steven Kopits: When you plot in log terms, a constant growth rate shows up as a straight line; when you do it in levels, it looks like it is accelerating.
No! Really? You mean, it looks like a stimulus cracking up a deficit of 12.6% of GDP blew up the west coast port system? Who knew!
Let me quote Krugman for you, from yesterday:
“[As] I and many others have noted, [the inflationary surge] involves supply chains. The conveyor belt that normally delivers goods to consumers suffers from shortages of port capacity, truck drivers, warehouse space and more, and a shortage of silicon chips is crimping production of many goods, especially cars. A recent report from the influential Bank for International Settlements estimates that price rises caused by bottlenecks in supply have raised U.S. inflation by 2.8 percentage points over the past year.”
This sounds like ports are unable to operate at normal capacity due to a lack of labor and equipment, that inflation is the result of workers not returning to their jobs and somehow a lack of equipment. The port data makes absolutely clear that this assertion is false. Ports are running close to 20% above normal. Any why is that? Because a gargantuan stimulus has blown out the trade deficit — just as you argued the Trump tax cuts would, and did (see your own graph above) . This has resulted in a surge of imports so extreme that it has overwhelmed the west coast port system.
Thus, we are speaking of a man-made crisis, the result of policy decisions by the White House and the Federal Reserve. We seem to be in agreement on that.
https://www.nytimes.com/2021/12/16/opinion/inflation-economy-2021.html
Steven, when you say: “Thus, we are speaking of a man-made crisis, the result of policy decisions by the White House and the Federal Reserve. We seem to be in agreement on that.” The agreement is limited to the conservative side of the electorate. When reading the comments and articles here, the opposite to policy as a component is the norm.
Luckily, these beliefs do not reside in the electorate, yet.
And let me ask you this: How do you unwind a 12.6% of GDP budget deficit without a real stiff recession?