The Bureau of Economic Analysis announced today that seasonally adjusted U.S. real GDP grew at a 6.9% annual rate in the fourth quarter, more than twice the average growth rate the U.S. has seen since World War II.
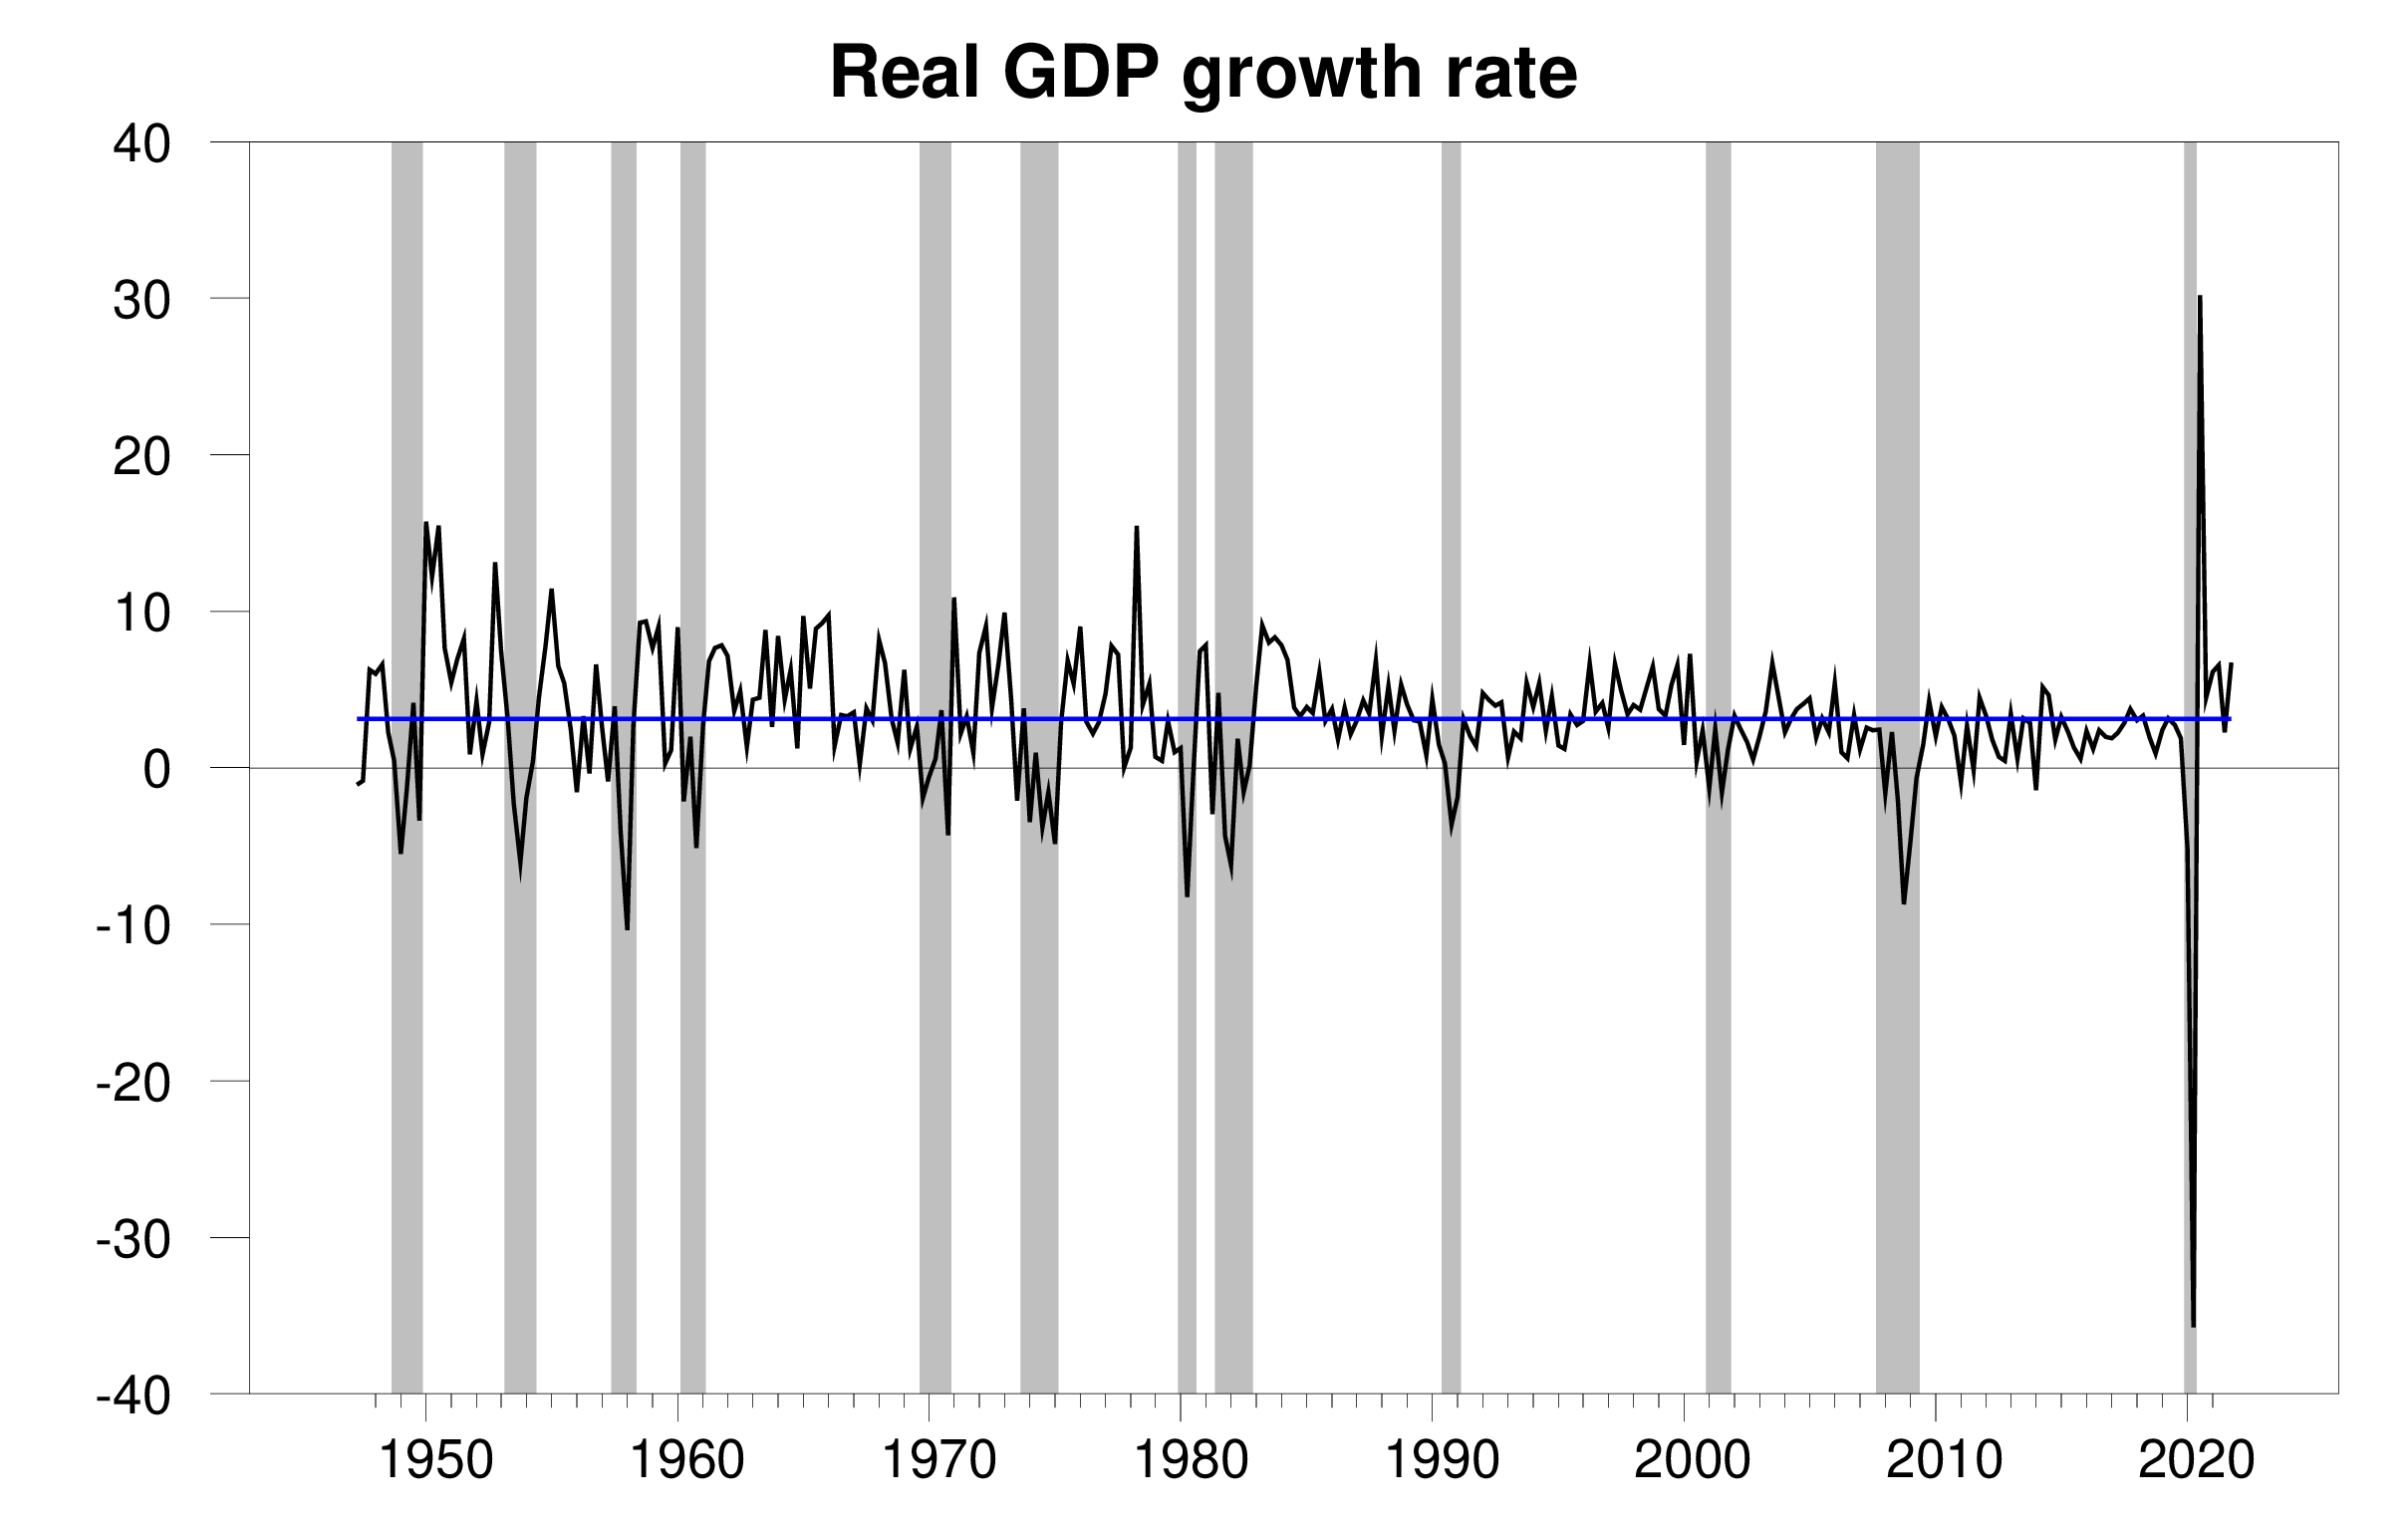
Real GDP growth at an annual rate, 1947:Q2-2021:Q4, with the historical average (3.1%) in blue. Calculated as 400 times the difference in the natural log of GDP from the previous quarter.
The new data put the Econbrowser recession indicator index at 1.2%, historically a very low value and signalling an unambiguous continuation of the economic expansion. The number posted today (1.2%) is an assessment of the situation of the economy in the previous quarter (namely 2021:Q3). We use the one-quarter lag to allow for data revisions and to gain better precision. This index provides the basis for an automatic procedure that we have been implementing for 15 years for assigning dates for the first and last quarters of economic recessions. As we announced a year ago, the COVID recession ended in the second quarter of 2020. The NBER Business Cycle Dating Committee subsequently made the same announcement in July.

GDP-based recession indicator index. The plotted value for each date is based solely on the GDP numbers that were publicly available as of one quarter after the indicated date, with 2021:Q3 the last date shown on the graph. Shaded regions represent the NBER’s dates for recessions, which dates were not used in any way in constructing the index.
This puts the level of GDP 3% higher than it was at the end of 2019 before the recession. Since then we’ve seen some growth of the population and capital stock along with improvements in technology, so we’d hope to do more than just get back to where we were in 2019. According to the Congressional Budget Office estimate of potential GDP, we’re still half a percent below where we’d expect to be based on long-run factors if there had been no recession. But we’re getting there.
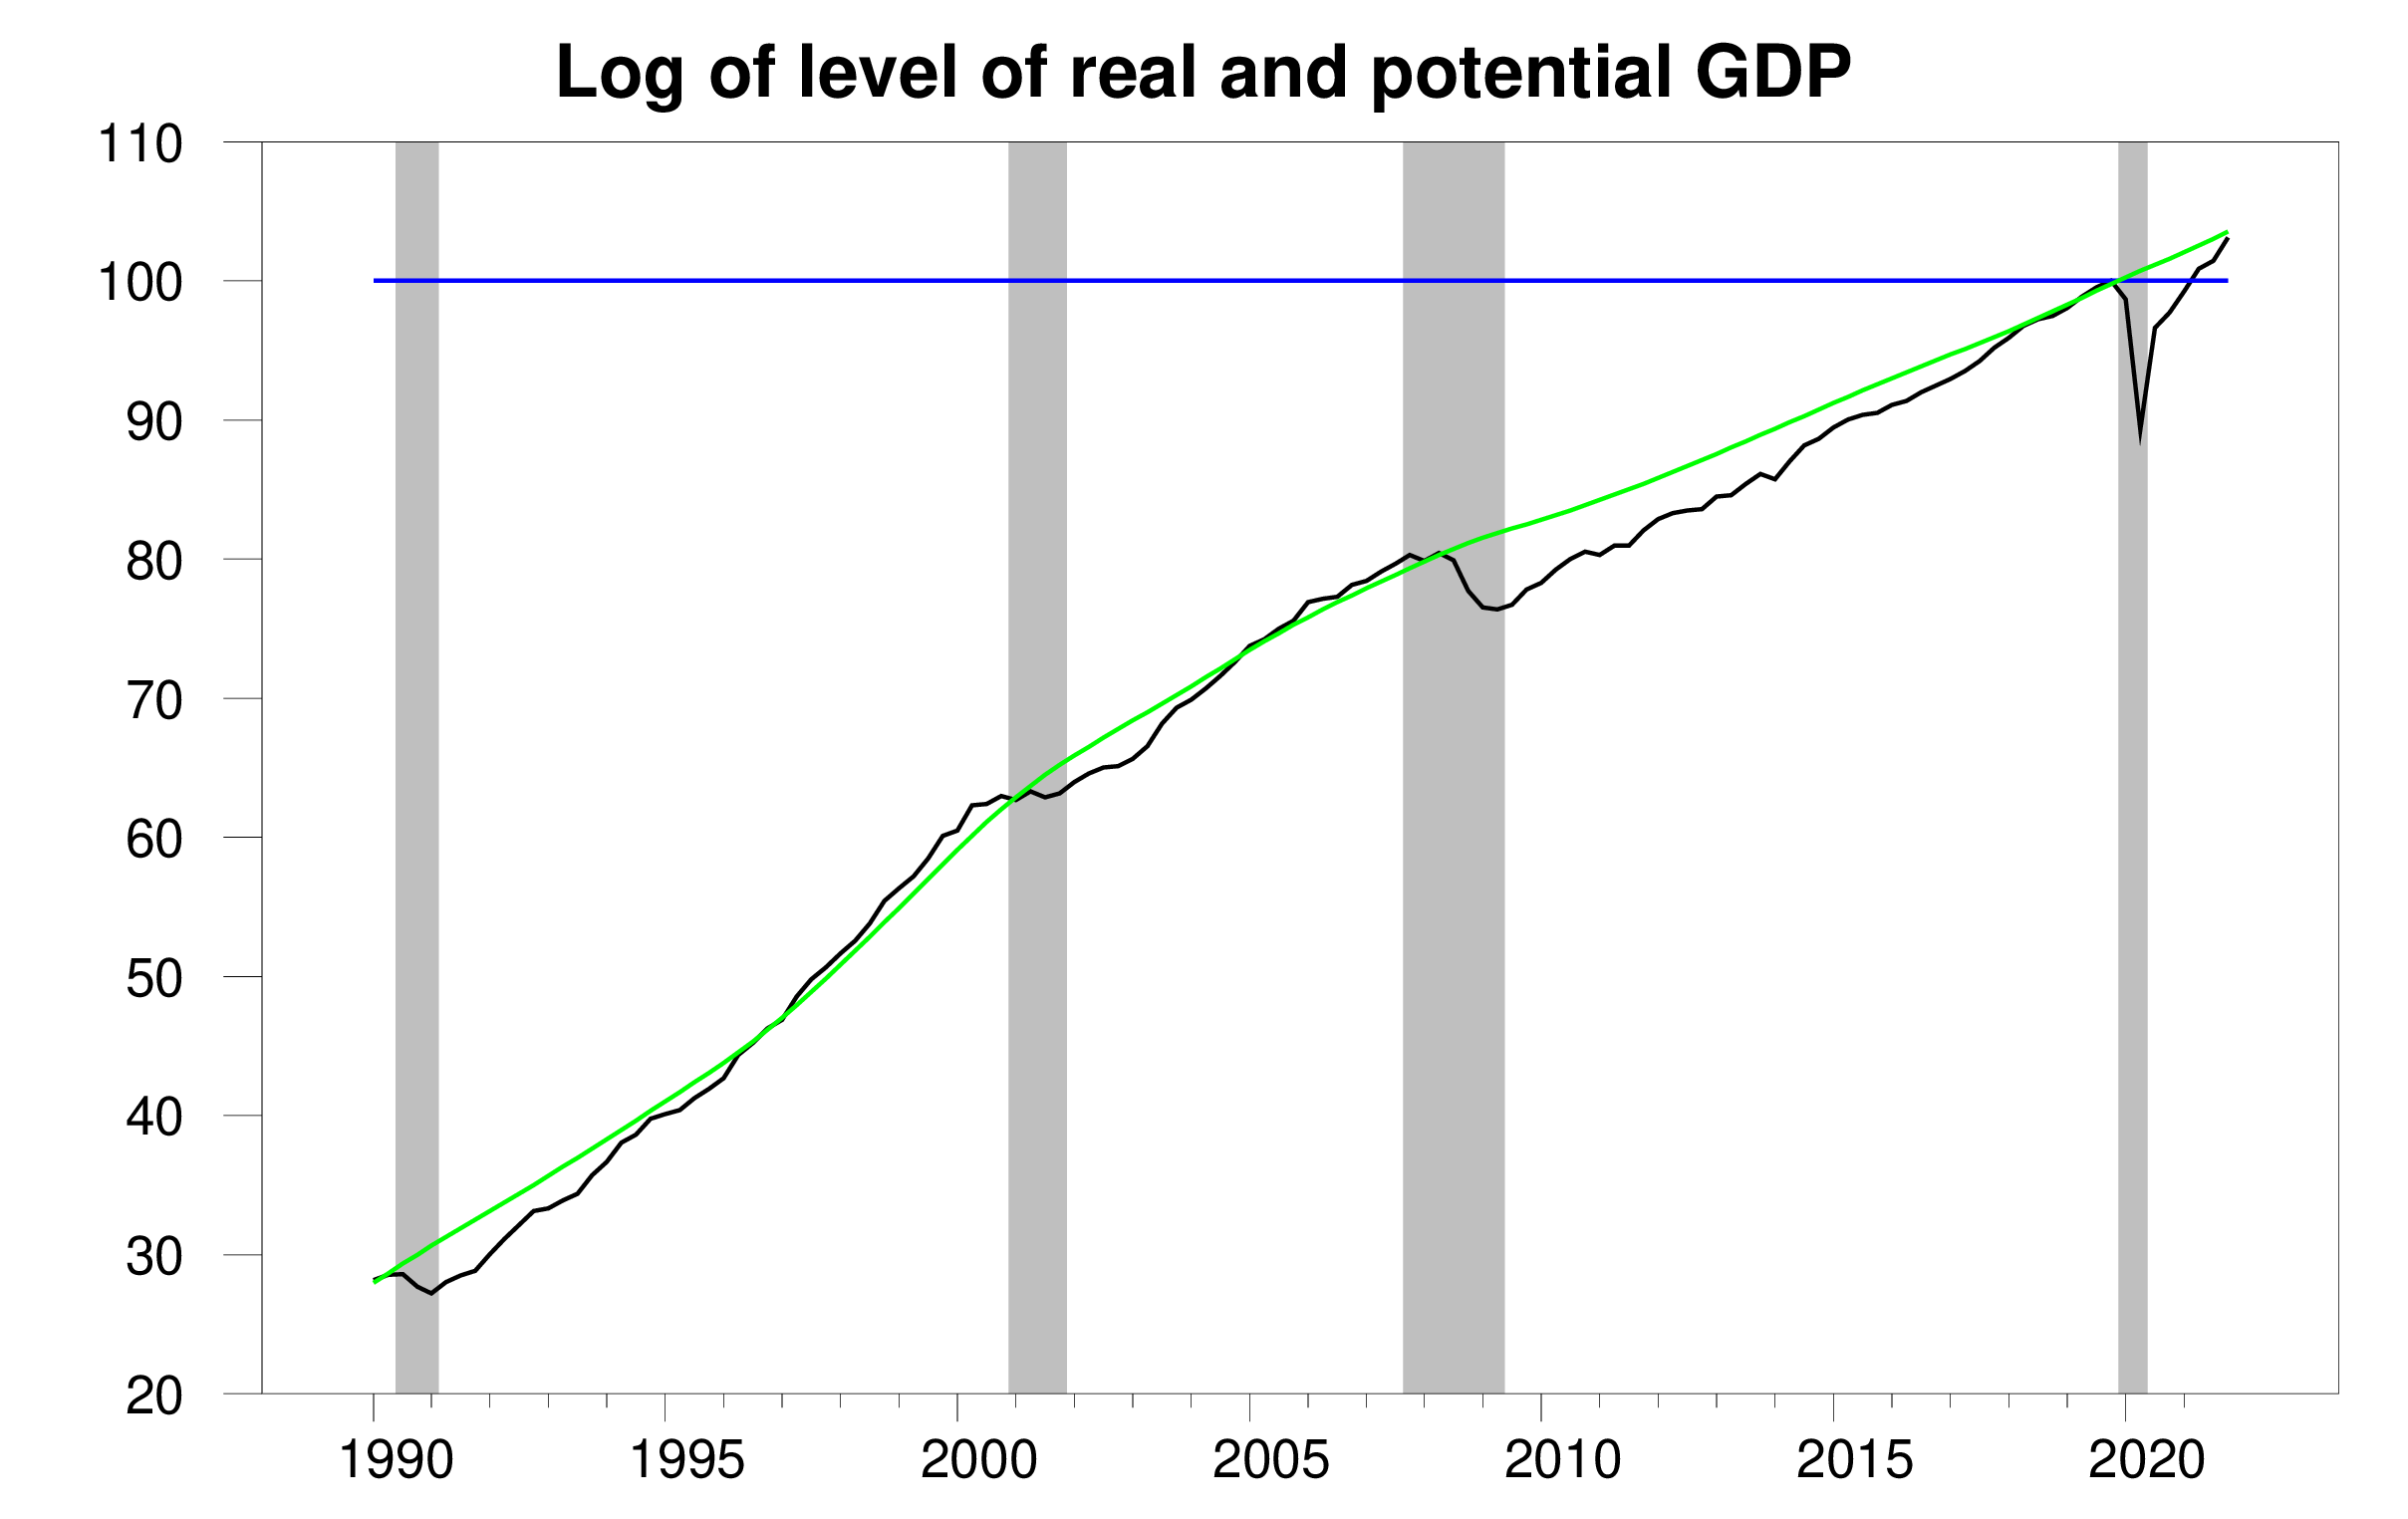
100 times the natural logarithm of the level of real GDP, 1990:Q1 to 2021:Q4, normalized at 2019:Q4 = 100. A movement on the vertical axis of 1 unit corresponds to a 1% change in the level of real GDP. Blue line marks level of GDP in 2019:Q4, and green is CBO estimate of potential GDP.
Increases in inventories accounted for more than 2/3 of the quarter’s growth in GDP. Under some circumstances that could be a bad sign, if consumers and businesses had stopped buying and unsold goods were piling up on shelves.
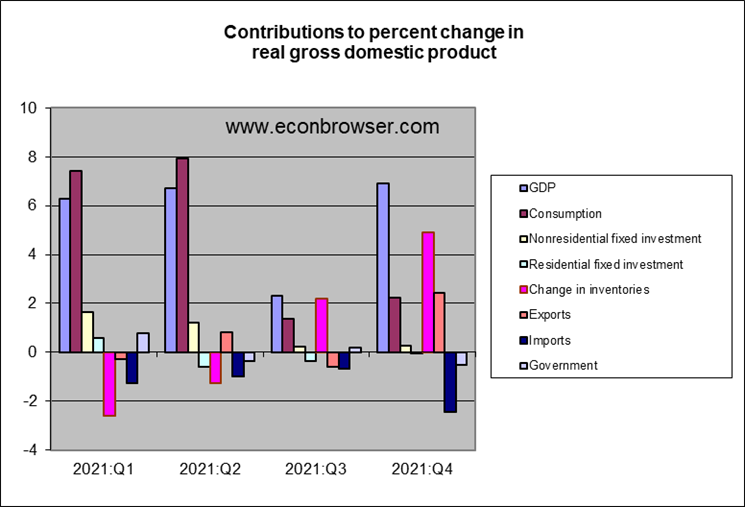
But that’s not what’s going on right now. Supply disruptions associated with COVID-19 brought inventories of many items like automobiles well below normal. The inventory rebuild is an expected result as we start to solve some of those problems on the supply side and is a positive indicator of real growth. And I think there is more to come. Problems with chip supplies have still been holding auto inventories back from where they hopefully soon will be. When that happens, it would bring another boost to future GDP growth.
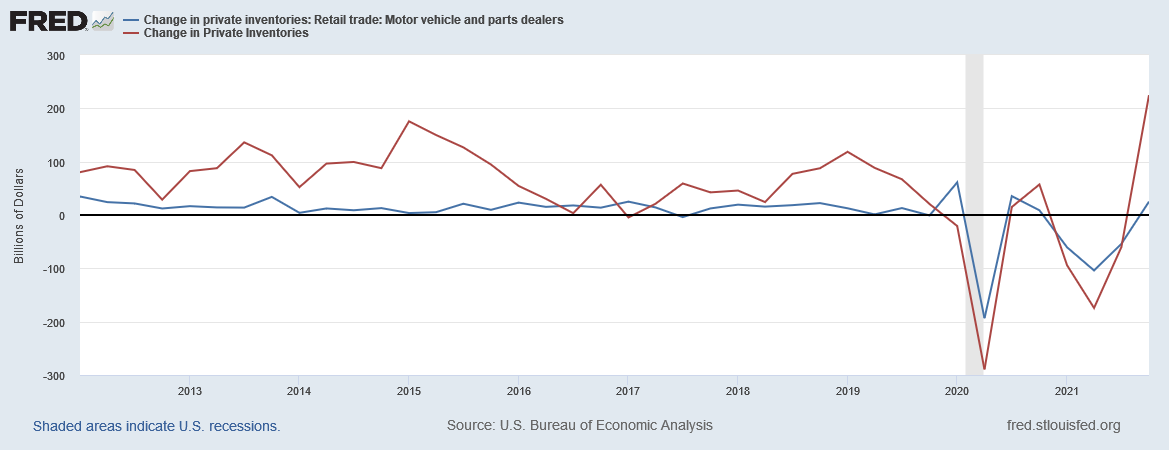
Nominal inventory investment, quoted at a quarterly rate, 2012:Q1-2021:Q4. Red line: Change in dollar value of all private inventories. Blue line: change in dollar value of inventories of dealers of motor vehicles and parts.
It’s also surprising that we haven’t seen more of a boost to new home construction (“residential fixed investment” in turquoise on the previous graph) with the real estate market as hot as it’s been. Supply issues may have played some role in holding housing construction back as well.
Bottom line: we can expect faster-than-normal growth to continue even as GDP starts to move above the CBO estimate of potential.
The CBO can’t adjust its method for estimating potential output every time something quirky happens, so I wonder whether the current estimate isn’t a bit high. The CBO estimates labor force participation using a method which is “relatively successful in capturing historical trends in participation that occur over periods much longer than individual business cycles.” Given the sudden dowward departure of participation from historic trends in some demographics, the potential output estimate may be high.
On a separate point (and repeating myself), the period of GDP undershoot relative to potential has been quite brief even if one ignores the depth of the recession. Considering the depth of the recession, the time to full recovery is remarkable. Good fiscal policy and good vaccines deserve much of the credit.
“Strange” how better public health policy and better public health messaging can have a positive effect for any individual nation’s macroeconomic outcomes, isn’t it??
Thanks Mike Pence, for not being a ____ for once in your life.
Does the current GDP growth signal that the economy can and should have higher interest rates? If so, how high should we go?
I think if we assume there are no more major mutations/variants, the answer to that question is rates will rise. Basically if we’re only discussing the Fed, you’re talking about three separate 1/4 percentage point increases for 2022. Arguably this stuff is moving pretty fast, because I remember recently reading one of the credit rating agencies saying the first rate hike wouldn’t start until September, so going from September and moving it up to March is a pretty damned big deal the way I am looking at it.
But the inflation has been much higher than I originally foresaw, so maybe you don’t want to be listening to me too much on this. I still think the wise move here is letting the rates change on their own (no Fed change on rates) and do the tapering.
As to more major variants/mutations:
https://abc7.com/subvariant-omicron-covid-variant-ba-2-update/11510936/
Too soon to tell, it seems.
Since learning the lesson of the oil embargoes, the Fed has seen negative supply shocks as reason to tighten (or at least not to ease), negative demand shocks as reason ease. Covid has been both, but with fiscal policy effective in lessening the demand shock. So as to the Fed’s eventual attitude toward policy under Covid, it’s too soon to tell, though for now inflation and the output gap rule the day.
Things are going okay, and I’ll keep my fingers crossed on the low recession risk and hopefully, a downward trend in Covid casualties. I continue to be disturbed by the high vacancy rates for retail shops on Newbury Street in Boston, but that was always a distorted market. I doubt that a broad based apocalypse in commercial real estate will happen, although some regional markets may have some nasty problems, particularly in a higher interest rate environment.
Single family homes–both new starts and renovations–is still in a tough spot. Lead times for windows and other specialty items are still bad. Long run impacts of zoning regulations are a problem that pre-dates the pandemic recession AND the great recession. I’m curious to see what 30 year mortgage rates at 5% will do to demand.
I don’t think it’s just supply chains impacting housing. I would ask, why should it keep growing in the face of strong demand and rising prices? Are there construction workers not working? Is there a robust pipeline of new workers available to provide an elastic labor supply? It doesn’t matter how much more lumber gets sawed, if there aren’t carpenters to hammer it, you don’t get more framing done.
Residential construction got crushed after the housing bubble. How quickly are former workers going to go back, especially if they found something new in the prior 10 years. Are immigrants coming to add to the construction labor force?
One of the biggest areas of economic research today should be market dynamics with in elastic supply (see TSMC as well). To extend TSMC, what do they fab? Not cheap auto chips, but the highest priced chips for apple & other consumer electronics products. Construction has shifted to higher priced jobs too.
Reportedly, the core of the labor pool for residential construction is old enough to be retiring at a rapid rate, with not enough effort to train new workers.
Journalists mostly rely on knowledgeable sources for reporting and knowledgeable sources in this case mostly means management in residential construction firms. It’s management’s job to marshal sources. They didn’t. They are never going to acknowledge that they smooched the pooch, but they will tell reporters that there “aren’t enough workers”.
The high cyclicality of residential construction is a problem, but it has always been a problem. This time, they have a greater problem finding workers than in the past. Management failure.
it’s not just construction, it’s systemic, ie, there’s still about 1.6 job openings for each person looking for work….
even so, the politicians are still touting policies that will create jobs, when they should be looking for a way to create workers
Can I count as many false positive spikes in the recession indicator as true positives, giving your tool very low power useless for anything?
What do economists contribute to GDP again? Bad models with no predictive accuracy?
rsm,
What on earth is this utterly incoherent comment about? Menzie is simply reporting recent data. I do not see any “false positive spikes in the recession indicator” that you seem to claim he is supposedly exhibiting here. What are you talking about and why do you seem to be so totally out of it? The qquality of your already largely stupid and ignorant and irrelevant comments is continuing to degenerate further, if that is even possible.
The post was from Dr. Hamilton not Dr. Chinn. But you are correct – the spikes seem to be pretty well aligned with actual recessions. I guess rsm had a little too much strange brew when he wrote his latest incredibly dumb comment.
Now holding any model to account for its forecast errors is fair game but has rsm even designed a forecasting model? Can we see how well his model did? Of course not as rsm has no idea what models or forecasting even means.
My apologies to Jim for not catching that this was his post.
Increases in inventories accounted for more than 2/3 of the quarter’s growth in GDP. Under some circumstances that could be a bad sign, if consumers and businesses had stopped buying and unsold goods were piling up on shelves. But that’s not what’s going on right now. Supply disruptions associated with COVID-19 brought inventories of many items like automobiles well below normal. The inventory rebuild is an expected result as we start to solve some of those problems on the supply side and is a positive indicator of real growth. And I think there is more to come. Problems with chip supplies have still been holding auto inventories back from where they hopefully soon will be. When that happens, it would bring another boost to future GDP growth.
Dean Baker made a similar point. We’ll have to take a close look at these details over the next few quarters.
financial inventory accounts principles… the accountants are prolly telling the supply chainers ‘they “laid in stuff that don’t move” so cut orders……
which as a former supply chainer usually leads to wrong stuff on shelf and nothing to sell of the right stuff.
someone should start a comic about a supply chain manager.
“ The initial GDPNow model estimate for real GDP growth (seasonally adjusted annual rate) in the first quarter of 2022 is 0.1 percent on January 28.”
https://www.atlantafed.org/cqer/research/gdpnow
Nice to have such a smorgasbord of forecasts! Consumer choice comes to forecasting!
So when are we going to see your forecasting model
Maybe you failed to read this:
“Latest estimate: 0.1 percent — January 28, 2022
The initial GDPNow model estimate for real GDP growth (seasonally adjusted annual rate) in the first quarter of 2022 is 0.1 percent on January 28. The initial estimate of fourth-quarter real GDP growth released by the US Bureau of Economic Analysis on January 27 was 6.9 percent, 0.4 percentage points above the final GDPNow model nowcast released on January 26.”
This very advanced forecast (which they note mimics what BEA does) will be revised as new data comes out. And not its nowcast for 2021Q4 was pretty close to the BEA’s latest release.
But Johnny boy thinks he was the right to mock forecasters? Like he has such an incredibly accurate forecasting model!
Of course, pgl didn’t notice the blue chip consensus or the average of top 10 and bottom 10 forecasts.
I wonder, does Las Vegas let people bet on economists’ forecasts? The bettor assigned odds might be instructive!
Definitely hoping things get back to normal, boom even. I’m sick of Covid impact on the economy.
“It’s also surprising that we haven’t seen more of a boost to new home construction”
I can share two anecdotal pieces in relation to this. first, I live “inside the loop”, where plots of land are harder to come by. we have several empty lots within a football throw from my house, which have sat empty for several years now. and then a few months ago, bam! two lots were developed with two new homes apiece, priced above the $700k level. interestingly, those lots used to develop 4 townhomes. now they are producing 2 larger garden homes. there are still some empty lots, waiting for even pricier homes, but not built yet. but it has been interesting to see these 4 homes go up so quickly after so much silence. perhaps small developers are having a little easier time with starts than big developers, who may have difficulty accessing the volume of materials to get their projects off the ground. second, we are having some work done on the house-typical repair and replacement stuff. doors were available within a couple of weeks. however, a variety of windows have a lead time of 2 to 3 months. so supply chain issues are still out there and hindering progress. my wife is not happy about this.
WolfStreet has a piece on new home construction. Lots of sales; not nearly so many completions.
Link: https://wolfstreet.com/2022/01/26/construction-costs-spike-17-5-worst-since-at-least-1965-inventories-of-new-houses-pile-up-highest-since-2008-median-price-dives-as-mix-shifts/
The basic message of this story that some people are willing to buy a newly constructed house even before the construction is completed. This is not that much different than buying a fixer upper. Pay the price and then pay for the additional construction too. Old idea in new clothing.
The basic message was that people can buy all the new houses they want…but builders are not be able to let them move in because they can’t finish construction. This is more like today’s new auto market where Honda is pushing “build your own,” I.e. order now, get delivery at some point in the future as yet to be determined. Not at all like fixer uppers, where buyers get delivery first and then make improvements.
I bet you never owned a fixer upper. Home Depot designed its entire business model around such owners.
And I also bet you never figured out how to put your IKEA furniture together.
Rig count up 6 (4 oil, 2 gas).
https://rigcount.bakerhughes.com/na-rig-count/
Every little bit helps. But still overall pretty disappointing, given the prices. Yes, they are backwardated, but even if you look at DEC23*, it’s still $72. Which in the past would have meant massive rig mobilizations.
*My quick thumb rule for capital budgeting. Of course a proper model has the detail keyed in. But figure about 8 months before you get first oil. The 2 year ahead price is kind of reasonable mix of the slope, especially given you won’t have first flows until end 22, early 23. And then flows strongest at the beginning (and less discounted). I end up preferring DEC or JUN since those months are more heavily traded…although near term strip, not an issue.
610 rigs is still 23.1% below the prepandemic rig count, and 1,319 fewer rigs than the shale era high of 1,929 drilling rigs that were deployed on November 21st of 2014, just before OPEC began to flood the global market with oil in an attempt to put US shale out of business….
rjs:
Agreed. It’s disappointing.
We need more US production to drive gasoline prices down. Oil supply/demand are relatively inelastic. Small changes can have significant price impacts.
In addition, US supply is a destabilizing influence on OPEC+ cartel. Looking at 2014 (and even 2018), you can see OPEC+ comments/actions related to moving from price support to share battle (to the benefit of consumers).
I am still hopeful that the industry (and more importantly investors) get over their issues with the new administration (especially JenniG, Secy DOE) and just get back to growth mode (more CAPEX, less dividends). Obviously there’s no love lost. But if we could get back to the benign neglect of the Obama years (“all of the above” energy policy), there are significant things this industry can do. Lots of rock left to chew. And the best energy services industry/infrastructure on the planet.
We’ve proved seriousness of US production in in the past. Just look what we did to the peak oil fad, including on this blog. E.g. https://econbrowser.com/archives/2007/05/peak_oil_in_ame (So much for “inexorable decline” path!)
You have probably countless comments ala Princeton Steve that we are in a very worrying housing bubble. Well Kevin Drum does not think so. Let’s check out Kevin’s position as opposed to what Princeton Steve keeps hammering about:
https://jabberwocking.com/are-we-in-another-housing-bubble-2/
First of all – Kevin follows the fundamentals like price to rent ratios, interest rates, etc. Stevie? He has no clue what fundamentals even are.
Now Princeton Steve says he reads CalculatedRisk, which is an excellent blog. Kevin does too. And Kevin understands what Bill McBride is saying. Alas Princeton Steve does not.
But we have been through this over and over again so maybe Kevin is just reading the comment section here so he can write something smart and informative!
This is a key passage from CalculatedRisk even if I have a small nit:
“Note that by this index, during the early ‘80s, homes were very unaffordable due to the very high mortgage rates. During the housing bubble, houses were also less affordable using 30-year mortgage rates, however, during the bubble, there were many “affordability products” that allowed borrowers to be qualified at the teaser rate (usually around 1%) that made houses seem more affordable. In general, this would suggest houses are somewhat affordable right now (due to low mortgage rates).”
Mortgage rates (nominal and real) are now a lot lower than they were in 2006/7. Which says housing prices/rent should be higher. The nit has to do with the early 1980’s when nominal rates were extremely high in nominal terms but not so much in real terms.
the big jump in 4th quarter inventories puts 1st quarter GDP in a hole…inventories grew by an CH12$ adjusted $173.5 billion in the 4th quarter, after shrinking at an CH12$ adjusted $66.8 billion in the 3rd quarter, and as a result the $240.3 billion positive change in real inventory growth added 4.90 percentage points to the 4th quarter’s growth rate…..to get a positive inventory contribution to 1st quarter GDP, we’d have to beat that $173.5 billion CH2012$ increase, which will be even more difficult in a period of persistently high deflators….on the other hand, if real inventories should be flat in the first quarter, that would subtract 3.54 percentage points from GDP…
another hill for the first quarter to climb is real PCE, which fell by 0.2% in November and 1.0% in December…that means first quarter real PCE starts out 1.2% lower than October and 1.0% lower than November…
Maybe this is why the Atlanta FED’s Nowcast has suggested Gross Domestic Production will not be increasing a whole lot. Maybe we should be focused on the BEA reporting of final demand growth since the inventory levels have basically been restored.
notice i made a little logic mistake in my estimate there; flat real inventories would only subtract 3.54 percentage points from 1st quarter GDP if GDP is virtually unchanged from the 4th quarter; ie, $173.5 billion in CH2012$ accounted for 3.54 percentage points of the 4th quarter GDP increase; it’s likely to have a slightly different impact on 1st quarter GDP..
Yep. The math is bad for Q1. That doesn’t mean the underlying dynamic is bad. The problem is that Q4 was distorted. Catch-up inventory building in Q4 will be hard to match in Q1 and consumers front-loaded holiday spending in a quarter tha is easily distorted by monthly seasonal adjustment mismatches. That’s not deadly for growth, but it sure messes with the numbers.
It’s entirely possible GDP will actually fall in Q1, even as the Fed hikes rates. Won’t Powell have fun explaining that? Especially when y/y inflation is likely to cool starting in April. Wouldn’t want his job.
Speaking of contraction, German GDP fell in Q4. Not sure, but I don’t think Germany’s contraction was just a matter of a couple of data oddities.
“GDP almost back to potential”
Ah, but what is “potential”. It seems to be one those nebulous criteria like NAIRU that hawkish economists make up out of thin air to justify putting their boot on the necks of wage earners when they think they are getting too big a share of national income. They have been having their way for the last four decades and don’t like it one bit when workers have recently started to demand higher wages.
This came up in the 2016 Democratic primaries when Gerald Friedman wrote an insane paper without ever thinking about what full employment looked like. Sure the CBO estimate may have been a bit conservative but there is no why the 2016 GDP gap was over 20%.
A small, but still problematic issue for growth this year is that households have been increasing their use of mortgage equity wihdrawal to fund consumption since the recession. Bill McBride puts MEW in Q2 and Q3 of last year at the highest share of disposable personal income since the last gasp of the housing boom. Not excessive by historical averages, but still above 3% of DPI.
With mortgage rates rising, MEW is likely to cool, taking a small chunk out of consumer demand. With real disposable personal income down in each of the last 5 months of 2021 and down from year ago as of December, that’s two chunks out of consumer demand. This seems to me a more serious problem than inventory swings and the timing of holiday sales.
Bill McBride: https://calculatedrisk.substack.com/p/the-home-atm-in-q3-2021
Interesting post from Bill McBride. Now before Princeton Steve goes all chicken little misrepresenting this data, let’s note this:
‘Mortgage debt is up $800 billion from the peak during the housing bubble, but, as a percent of GDP it is at 49.6%, down significantly from the peak of 73.3% of GDP during the housing bubble. This means most homeowners have large equity cushions in their home, and some MEW is not a concern.’
Let’s say someone buys a house for $2 million and has $1 million in debt. Even if the value of this house falls by 50%, he is still not under water. Something tells me that the housing market is not going to retreat by anything close to that.
Frac spreads +4 to 261. Good gain, but we are still below the pre-holidays level of 275. Commenter said he thought we’d be at 300 by March, a couple weeks ago. But seems to be slower than that (just my sense, no calculation).
https://www.youtube.com/watch?v=PNoFOp2lgIU
I notice that Real Private Inventory as a percent of Real GDP has declined from about 22% of Real GDP as of 1950Q1to about14% of Real GDP as of 2021Q4. Is this change due to just-in_time inventory systems or are there other reasons?
What do you use for real private inventory? This is an interesting question but I was wondering if this decline is a longer term issue or something mostly related to the pandemic.
AS – FRED has your series dating back to 1947:
https://fred.stlouisfed.org/series/A371RX1Q020SBEA
I compared 2019Q4 (before the pandemic) to 1947Q1.
Real GDP just before the pandemic was about 9.6 times real GDP in 1947Q1.
Real private inventories before the pandemic were about 6 times their level in 1947Q1.
So the inventory to GDP ratio fell from 24% to just over 15% just before the pandemic.
So yea – an interesting question. Part of this indeed was the Toyota Lean Production idea we call Just in Time Inventories, which Bruce “no relationship to Robert” Hall thinks is the only way to run a business. Of course in light of the semiconductor shortage even Toyota knows this was not the best idea they ever came up with.
Hi PGL,
I arbitrarily used 1950.
I am now looking at real personal consumption for goods and services, using the log ratio that Professor Chinn introduced us to in 2013, if not before. It looks like real personal consumption related to goods grew faster from 2002 to 2021 than real personal consumption for services. I am double checking my calculations. Detail on real personal consumption for goods and services goes back to only 2002 that I could find on BEA. I am surprised about the faster growth in real personal consumption for goods compared to services, since I thought we had become more of a service economy.
I thought we have moved to a service economy. Enlightenment would be appreciated. Real goods consumption seems to have eclipsed real services consumption since 2002.
If we calculate the log ratio of (Goods/ GDP) from 2002 to 2021 for personal consumption of goods and add goods imports and subtract goods exports, the 2002 initial log ratio using natural logs is -1.2951. The 2021 terminal ratio is -1.0263. Taking the difference shows a value of 0.2688. Divide by 20 years and multiply by 100 to show the compound difference in growth between GDP and goods consumption. The result is about 1.3 percent: ((-1.0263 + 1.2951)/20)*100. Goods consumption increased at a continuous rate of about 1.3 percent more than GDP over 20 years. Making the same calculations for services, consumption of services decreased by about -0.4 percent compared to GDP.
See Professor Chinn’s blog entry describing the log ratio.
https://econbrowser.com/archives/2013/12/government_spen