We hear a lot about how expansionary US policy has led to accelerated inflation. Is that inflation much faster than what occurred in other regions? Consider the US, Euro Area and UK 3 month annualized consumer inflation rates (calculated as log differences).
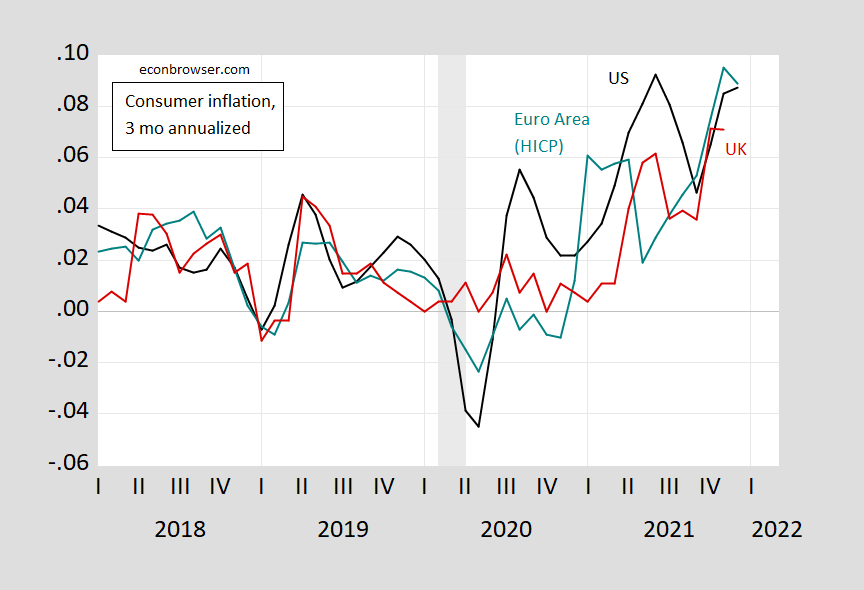
Figure 1: Three month annualized inflation rates for US CPI (black), Euro Area HICP (teal), and UK CPI (red). Euro Area HICP seasonally adjusted by author using geometric X-12 before calculating inflation rates. NBER defined recession dates peak-to-trough shaded gray. Source: BLS, Eurostat, ONS via FRED, NBER, and author’s calculations.
US inflation has recently been higher than that in Euro Area and the UK. But has it been significantly so, either quantitatively or statistically? In order to answer this question, I examine the time difference in the difference between US and Euro Area (US and UK) inflation, going from pre- to post-covid periods. This is an application of the differences-in-differences approach.
Define the annualized month/month inflation difference US vs. country i:
![]()
Take this variable and run the following regression:
![]()
Where covidt is a dummy variable taking a value of 1 from 2020M02 onward.
The α coefficient is the pre-covid inflation differential between the US and country i; the β coefficient is the change in the inflation differential post-covid.
Using HAC robust standard errors, I find that the estimated β coefficient is 0.0028 for US-Euro Area (HAC robust standard error 0.018), and 0.0098 for US-UK (standard error 0.010). In neither case does the t-statistic for the null of zero on the β coefficient approach statistical significance at conventional levels.
So, while it’s true US inflation accelerated a percentage point more than UK, and 0.3 percentage points more the Euro Area, the difference is not statistically significant.
Frac count a little disappointing (if you like US production, like low prices).
https://www.youtube.com/watch?v=dENt7guIaSM
+3. But still down in the 250s. Was 270s before Xmas holidays. Really expected a huge surge this week. Maybe weather impact in the Marcellus. But still. Very tepid US activity remains.
Graph is a little hard for me to read, given all the gyrations. If you just look at 2021 total, for the three currencies, wonder how close/different they are. Integrating by eye, it looks like US a good bit worse. Although UK and EU also substantial.
Not clear to me, how the three months averaging works (just mechanically, not even a criticism). Like is it trailing three months or midpoint or what? Graph looks funky in not seeing end points later in 2021 (we had a DEC number already). And that said, I’m not clear the point of doing the 3 month subaverages anyways.
Other than that, curious how CHF doing. (Not a criticism, even, just curious.)
Anonymous: Graph is of ln(CPI[t]/CPI[t-3])*4; US and Euro Area data end 2021M12, UK at 2021M11. I did 3 months because easier to see than 1 months (used in the regression), while 12 months yields only almost 2 non-overlapping observations for post-covid sample.
I looked up the annual numbers. Not sure exactly how to do that, so just Googled news articles. US 7%, UK 5.4%, EU 5%. (Actually different articles said slightly different things on UK and EU, but low 5s, regardless)
All three noticeably higher than normal in the last 30 years-ish time frame. US doing a little worse than the across the pond crowd.
Oh, I guess from your graph, we get a bit of the sense of the trend. I.e. worse 2H21 than 1H21. And for all of them. So much for the transitory blip, outlier month from the spring. Got worse instead. But still, a trend that affected us in general.
[I expect 2022 will be down significantly. Not that I know anything about how to predict inflation. Just what the news articles say, so fine…take that as a Bayesian prior.]
So you don’t know how to look up data, but feel confident in commenting on it?
Anonymous: Pretty much any number you might want is at FRED.
Professor Chinn,
Thanks for showing us the inflation difference model. I found the British inflation on FRED: GBRCPIALLMINMEI.
Trying to replicate your inflation difference with Britain using differenced data from 2018m1 to 2021m11, I find the following:
INFDIFBRIT = 0.0041 + 0.0092, with neither of the values being statistically significant.
The HAC standard error on Covid for Britain is 0.0092, so I am a bit off from the answer book on
the Covid coefficient and on the standard error.
AS: I used log approximation for my inflation calculation. You can probably match if you use that instead of exact formula.
So logs compress standard errors? And aren’t you just using noise in the past to predict noise in the future, anyway?
Your daily worthless rant! Geesh!
Garbage in, garbage out, am I wrong?
rsm
GIGO is true and relevant if indeed what is going in is garbage. But that is not the case here. The person inputting garbage is once again you. Gag.
What you write is certainly garbage.
rsm: No, logs don’t compress standard errors. No, I’m not predicting the future at all in this post, so I can only guess that you have no comprehension of what is being done in this post.
https://www.nytimes.com/2021/11/30/opinion/inflation-united-states-europe.html
November 30, 2021
On the trans-Atlantic price gap
By Paul Krugman
This morning Eurostat, the European statistical agency, announced its “flash” estimate of November inflation for the euro area. It came in well above expectations — a 4.9 percent rise in prices over the past year. Still, this was lower than U.S. inflation: In October our consumer prices were up 6.2 percent over the year. And technical differences appear to downplay the U.S.-Europe difference. If we use a European-style index to calculate U.S. inflation over the past year, it was 7.3 percent.
Now, one-year inflation is a problematic measure right now, because many prices were temporarily depressed by the pandemic. Many commentators like to focus on price rises over two years to avoid this problem. When you do, however, the difference between the United States and Europe remains striking:
https://static01.nyt.com/images/2021/11/30/opinion/krugman301121_1/krugman301121_1-jumbo.png?quality=75&auto=webp
We’re No. 1!
Does lower (although still high) inflation in Europe tell us something about inflation here? A number of commentators have argued that the difference shows that deficit spending, which has been bigger in the United States, is a major cause of inflation. For example, Jason Furman, the former head of President Barack Obama’s National Economic Council, has put the Europe-U.S. differential at the core of his argument that the American Rescue Plan bears a lot of responsibility for current inflation:
https://static01.nyt.com/images/2021/11/30/opinion/krugman301121_2/krugman301121_2-jumbo.png?quality=75&auto=webp
Does Europe show that stimulus did it? …
https://fred.stlouisfed.org/graph/?g=L5WH
January 30, 2018
Consumer Prices for Euro Area and United States, 2017-2021
(Percent change)
https://fred.stlouisfed.org/graph/?g=IXud
January 30, 2018
Consumer Prices and Consumer Prices less food & energy for Euro Area and United States, 2017-2021
(Percent change)
Just looking at the figures Menzie shows and not the regressions or anything else, it looks like that while the US had higher inflation that either the UK or EU several months ago, for the last two months the US and EU seem to have converged and had about the same rate, while UK remains somewhat lower. Is that the xase, and how likely is that to continue? If it is the case, does this mean that the story of exceptionally high relative inflation in the US is basically over? How much longer will these global supply chain problems last and can anything be done to end them soon (aside from hoping no more Covid-19 variants appearing?).
My understanding is that while US nominal interest rates are still pretty low – the interest rate in the UK are lower while interest rates in the Euro area are even lower. Not to add anything to your plate – but it would be interesting to compare real rates among the US, UK, and the Euro area.
US Policymakers being only a hair more wrong than policymakers in Europe is not a great defense. They all still messed up, big time.
So not letting the economy plunge into a deep recession just so you can buy your chicken at last year’s nominal price is messing up? We have a new nominee for the dumbest comment ever.
I implied nothing of the sort. There are many settings on the dial in between doing nothing and going all the way to passing the ARPA and keeping QE going until 2022. Skipping the ARP and stopping QE in spring/summer of last year would not have plunged the economy into deep recession, and would have likely resulted in less inflation today.
Life tip, though I doubt you’re interested in self-betterment: you can do better by not attributing views to your interlocutors which they haven’t expressed, instead merely engaging with views they have expressed. It’s how grown-ups engage in intellectual discourse.
So much babbling – so little understanding of the actual economic issues. Look – we already have enough trolls here so just run away.
“It’s how grown-ups engage in intellectual discourse.”
From someone going by the name Anon. Seriously?
You haven’t engaged any of the actual economic points I made: that policymakers in several nations have put too much monetary and fiscal fuel into the system; that it was possible to put somewhat less policy fuel into the system without causing a “deep recession”; and that had they done so, inflation would be lower in those nations. Which, if any, do you disagree with? You haven’t indicated where you think I made an error, instead you just call my comments dumb, you call me a troll, you accuse me of having little understanding of economic issues and of “babbling,” and you make jokes about my handle here – as though nothing of quality had ever been written under a pseudonym.
You haven’t engaged in any meaningful intellectual discussion, and you are a shameful disgrace to your parents and educators. Good-bye.
Anon writes:
“US Policymakers being only a hair more wrong than policymakers in Europe is not a great defense. They all still messed up, big time.
And then he claims I did not engage in any of the points he made. Dude – your first comment make no points. Now maybe you are eventually getting around to trying. GEESH!
Anon,
But this is not a pseudonym. That would be an actual name. “Anonymous” is not a name.
Hey, I have a suggestion. You can call yourself “Rick Stryker.” Then people might think you are a hot porn star who appears on the covers of magzines. Or maybe you can call yourself “Econned,” and people will be really impressed because they will think you fully air your genitalia.
If you want to complain that those names are already taken, let me point out that lots of people use “Anonymous,” which is the problem. How do we know which “Anonymous” you are? Are you the one who seems to know a lot about the oil industry when you post here? Or are you a different one who makes a lot of seriously ignorant and stupid remarks here about other matters?
https://news.cgtn.com/news/2022-01-22/The-case-for-strategic-price-policies-171AF24WDgk/index.html
January 22, 2022
The case for strategic price policies
By James K. Galbraith
With a single commentary * in The Guardian (and an unintended assist ** from New York Times columnist Paul Krugman), economist Isabella Weber of the University of Massachusetts injected clear thinking into a debate that had been suppressed for 40 years. Specifically, she has advanced the idea that rising prices call for a price policy. Imagine that.
The last vestige of a systematic price policy in America, the White House Council on Wage and Price Stability, was abolished on January 29, 1981, a week after Ronald Reagan took office. That put an end to a run of policies that had begun in April 1941 with the creation of Franklin D. Roosevelt’s Office of Price Administration and Civilian Supply – seven months before the Japanese attack on Pearl Harbor.
U.S. price policies took various forms over the next four decades. During World War II, selective price controls quickly gave way to a “general maximum price regulation” (with exceptions), followed by a full freeze with the “hold the line order” of April 1943.
In 1946, price controls were repealed (over objections from Paul Samuelson and other leading economists), only to be reinstated in 1950 for the Korean War and repealed again in 1953. In the 1960s, the Kennedy and Johnson administrations instituted pricing “guideposts,” which were breached by U.S. Steel, provoking an epic confrontation. In the following decade, Richard Nixon imposed price freezes in 1971 and 1973, with more flexible policies, called “stages,” thereafter.
Federal price policies during this period had a twofold purpose: to handle emergencies such as war (or, in the cynical 1971 case, Nixon’s re-election) and to coordinate key price and wage expectations in peacetime, so that the economy would reach full employment with real (inflation-adjusted) wages matching productivity gains. As America’s postwar record of growth, job creation, and productivity shows, these policies were highly effective, which is why mainstream economists considered them indispensable.
The case for eliminating price policies was advanced largely by business lobbies that opposed controls because they interfered with profits and the exercise of market power. Right-wing economists – chiefly Milton Friedman and Friedrich von Hayek – gave the lobbyists an academic imprimatur, conjuring visions of “perfectly competitive” firms whose prices adjusted freely to keep the economy in perpetual equilibrium at full employment.
Economists with such fantasies held no positions of public power before 1981. But in the 1970s, the practical conditions for maintaining a successful price policy started to erode. Problems multiplied with the breakdown of international exchange-rate management in 1971, the loss of control over oil prices in 1973, and the rise of foreign industrial competitors (first Germany and Japan, then Mexico and South Korea).
Relations with organized labor started to go bad under Jimmy Carter, who also appointed Paul Volcker to run the US. Federal Reserve. But even as late as 1980, Carter imposed credit controls – a move that won public acclaim but also arguably cost him his re-election, because the economy slipped into a brief recession….
* https://www.theguardian.com/business/commentisfree/2021/dec/29/inflation-price-controls-time-we-use-it
** https://twitter.com/paulkrugman/status/1477247341212184577
James K. Galbraith is chair in Government/Business Relations at the Lyndon B. Johnson School of Public Affairs at the University of Texas at Austin.
https://twitter.com/paulkrugman/status/1477247341212184577
Paul Krugman @paulkrugman
Deleting, with extreme apologies, my tweet about Isabella Weber on price controls. No excuses. It’s always wrong to use that tone against anyone arguing in good faith, no matter how much you disagree — especially when there’s so much bad faith out there.
6:56 AM · Jan 1, 2022
So, it isn’t all Joe Biden’s fault?
Huh.
Who woulda thunk it?
I think the presentation would benefit from an indexed graph, say, 2019 = 100. This would allow us to see cumulative inflation in the various countries since the start of the pandemic.
If we were talking about commodity prices over time and our host had done one of those ltr charts using percent changes, I might agree. If we were on some fixed nominal price monetary standard, I might agree. But neither is valid.
https://news.cgtn.com/news/2022-01-22/Chinese-mainland-records-63-confirmed-COVID-19-cases-171tkoj8GZy/index.html
January 22, 2022
Chinese mainland reports 63 new COVID-19 cases
The Chinese mainland recorded 63 confirmed COVID-19 cases on Friday, with 23 linked to local transmissions and 40 from overseas, data from the National Health Commission showed on Saturday.
A total of 43 new asymptomatic cases were also recorded, and 778 asymptomatic patients remain under medical observation.
Confirmed cases on the Chinese mainland now total 105,547, with the death toll remaining unchanged at 4,636 since January last year.
Chinese mainland new locally transmitted cases
https://news.cgtn.com/news/2022-01-22/Chinese-mainland-records-63-confirmed-COVID-19-cases-171tkoj8GZy/img/bab3f624247447d4a1f3060dba773b71/bab3f624247447d4a1f3060dba773b71.jpeg
Chinese mainland new imported cases
https://news.cgtn.com/news/2022-01-22/Chinese-mainland-records-63-confirmed-COVID-19-cases-171tkoj8GZy/img/528f068a06c64ffda2ef5cd7973c5801/528f068a06c64ffda2ef5cd7973c5801.jpeg
Chinese mainland new asymptomatic cases
https://news.cgtn.com/news/2022-01-22/Chinese-mainland-records-63-confirmed-COVID-19-cases-171tkoj8GZy/img/9a0e509261cd4f0297e3b48ab2576332/9a0e509261cd4f0297e3b48ab2576332.jpeg
https://www.worldometers.info/coronavirus/
January 21, 2022
Coronavirus
United States
Cases ( 71,394,579)
Deaths ( 887,643)
Deaths per million ( 2,657)
China
Cases ( 105,484)
Deaths ( 4,636)
Deaths per million ( 3)
You continuously post this data.
Can you explain how 4,636 Chinese are dead while the USA is closing in on 900,000 dead?
Easy. Xi lies about the number of dead whereas your boy Trump lied about the need to socially distant.
Menzie,
As far as a I understand it, the ECB printed at least 2 trillion euros on top of other economy boosting measures. The UK also documents something like 412 billion GBP on COVID spending = $2.7 trillion scaled to US dollars and equivalent population.
While these numbers are smaller than the US money printing, they’re still very, very large.
As such – it doesn’t seem clear to me that your assertion that US money printing cannot be the primary cause of US inflation, because inflation in all 3 regions is similar, is very strong at all.
From my view – the main takeaway from the contrast of US vs. EU vs. UK inflation is that it is exceedingly unlikely that supply chain issues are a major cause of US inflation. I have seen no news about supply chain issues in the EU and UK, although that could be just because I am American.
c1ue: No supply chain issues in UK? Really?
https://www.nytimes.com/2022/01/17/business/brexit-food-imports.html
January 17, 2022
In London Shops, Greek Cheese, Sicilian Citrus and British Headaches
For companies depending on fast, small deliveries, the costs of new Brexit trade rules are mounting.
By Eshe Nelson
https://www.nytimes.com/2021/11/11/business/britain-economy-recovery.html
November 11, 2021
Britain’s economic recovery has slowed as supply disruptions persist.
By Eshe Nelson
The British economy’s recovery slowed through the summer, delaying its return to its prepandemic size as supply shortages hampered businesses and exports declined.
https://www.nytimes.com/2021/09/28/world/europe/brexit-britain-fuel-johnson.html
September 28, 2021
The U.K.’s Gas Crisis Is a Brexit Crisis, Too
Until now, the government has blamed Covid-related restrictions for a spate of shortages. But as virus restrictions ease and fuel runs short, the focus is shifting to Britain’s exit from the E.U.
By Mark Landler
https://fred.stlouisfed.org/graph/?g=u094
January 30, 2018
Interest Rates on 10-Year United States, United Kingdom, Euro Area and Japanese Government Bonds, 2007-2021
https://fred.stlouisfed.org/graph/?g=L6hm
January 30, 2018
Consumer Prices for United States, United Kingdom, Germany and Japan, 2017-2021
(Percent change)
https://fred.stlouisfed.org/graph/?g=L6hy
January 30, 2018
Consumer Prices for United States, United Kingdom, Germany and Japan, 2017-2021
(Indexed to 2017)
China was subject to significant producer or commodity price increases through 2021, but with the use of surplus stores Chinese regulators were able to completely limit producer and especially consumer price increases. Surplus stores are becoming increasingly broad, and often run to 2 years of supply. This, with 8.1% growth in GDP:
https://news.cgtn.com/news/2022-01-12/China-s-CPI-up-1-5-PPI-up-10-3-in-December-16KQLFMEDsY/index.html
January 12, 2022
China’s factory gate prices further ease, consumer prices drop in December
The Producer Price Index gained 8.1% for the year.
The Consumer Price Index gained 0.9% for the year.
https://news.cgtn.com/news/2022-01-12/China-s-CPI-up-1-5-PPI-up-10-3-in-December-16KQLFMEDsY/img/8b3ffe51d14e42f5a5a6d3014bc60107/8b3ffe51d14e42f5a5a6d3014bc60107.jpeg
https://news.cgtn.com/news/2022-01-12/China-s-CPI-up-1-5-PPI-up-10-3-in-December-16KQLFMEDsY/img/27b7e31ac68c4fa2a9e1dcbd08788341/27b7e31ac68c4fa2a9e1dcbd08788341.jpeg
https://fred.stlouisfed.org/graph/?g=Ftkb
January 30, 2018
Consumer Prices for China, India, Brazil, Mexico and South Africa, 2017-2021
(Percent change)
— lies about the number of dead…
— lies about the number of dead…
— lies about the number of dead…
[ This is an intensely hurtful comment, even if meant to be comical. The well-being of a couple of billion people in more than 100 countries depends on the Chinese detection, containment and treatment model being precisely correct, and the Chinese model is correct and being justly relied on by so many.
Please do not frighten and discourage people in so serious a matter, even though joking. ]
Oh my – how dare I say anything negative about Xi?!
Is inflation data enough to compare economic strength and whether extra stimulus was worthwhile? Do GDP growth comparisons matter at all? I wish this inflation fetish would stop.
I’m hopeful that no one has already posted this on this blog. I thought it was pretty good and kind of follows along with your thoughts Jacques:
https://twitter.com/paulkrugman/status/1484961505548382209
“If you’re going to argue that Biden’s troubles are all about falling real wages, you should explain why Rs successfully ran *on the economy* despite falling real wages in 1984 and 1988”
Krugman raises a good point and he should know as he worked on the CEA back in the 1980’s albeit most people in the Reagan White House ignored the good analysis from the CEA back then.
Reagan, however, had one unbelievable marketing team with its Morning in America 1984 ad, which somehow blamed the early failures of Reagan’s economic policies on Jimmy Carter. Yes – Republicans have been blatantly lying about economics most of my adult life.