Here’s a picture of several key macro indicators followed by the NBER BCDC, including today’s employment release and monthly GDP, and yesterday’s consumption and mfg/trade industry sales numbers. The recovery continues.
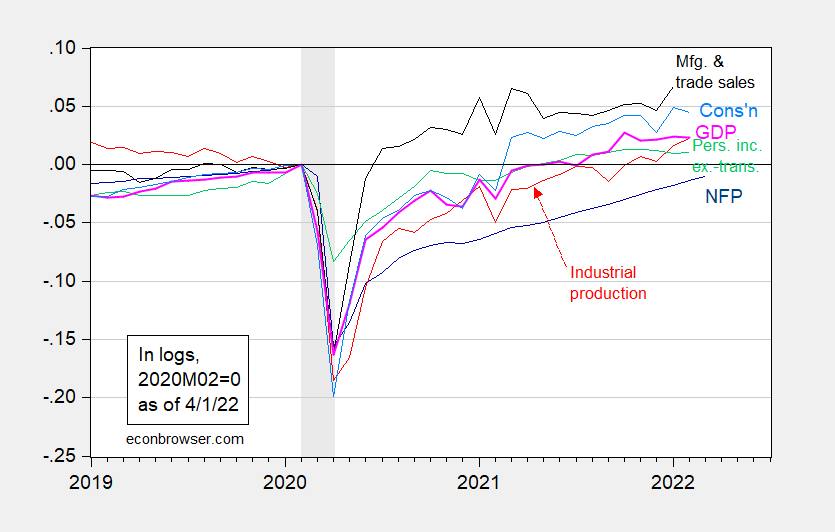
Figure 1: Nonfarm payroll employment (dark blue), Bloomberg consensus for February NFP (blue +), industrial production (red), personal income excluding transfers in Ch.2012$ (green), manufacturing and trade sales in Ch.2012$ (black), consumption in Ch.2012$ (light blue), and monthly GDP in Ch.2012$ (pink), all log normalized to 2020M02=0. NBER defined recession dates, peak-to-trough, shaded gray. Source: BLS, Federal Reserve, BEA, via FRED, IHS Markit (nee Macroeconomic Advisers) (4/1/2022 release), NBER, and author’s calculations.
The employment numbers were slightly under Bloomberg consensus (431K vs 490K), but the previous months’ numbers were revised upward.
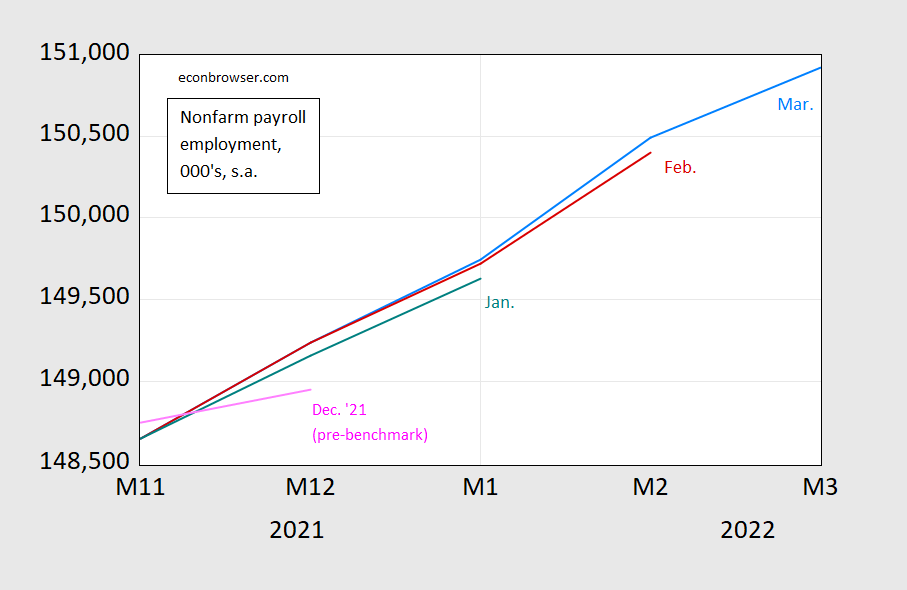
Figure 2: Nonfarm payroll employment from March release (light blue), February (red), January (red), Dec. ’21 (pink), all in ‘000’s, s.a., seasonally adjusted, on log scale. Source: BLS via FRED, various vintages.
Confidence that employment is continuing to increase is reinforced by the upward movement in alternative measures.
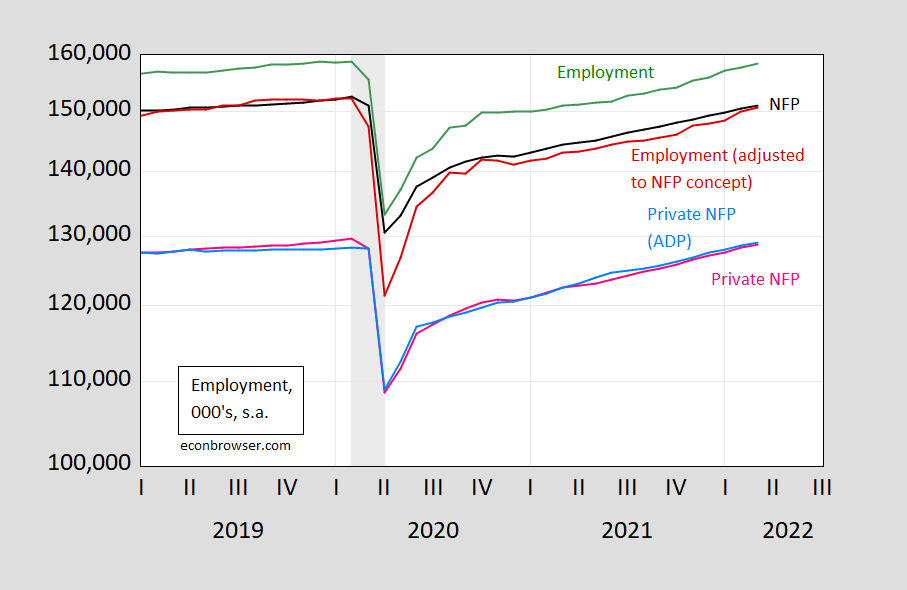
Figure 3: Nonfarm payroll (NFP) employment (black), civilian employment (green), civilian employment adjusted to NFP concept (red), private NFP (pink), and private NFP from ADP (light blue), all in 000’s, s.a., on log scale. NBER defined recession dates peak-to-trough shaded gray. Source: BLS via FRED, BLS, ADP via FRED, and NBER.
While employment continues to rise, some sectors continue to lag pre-peak levels. From CEA today:
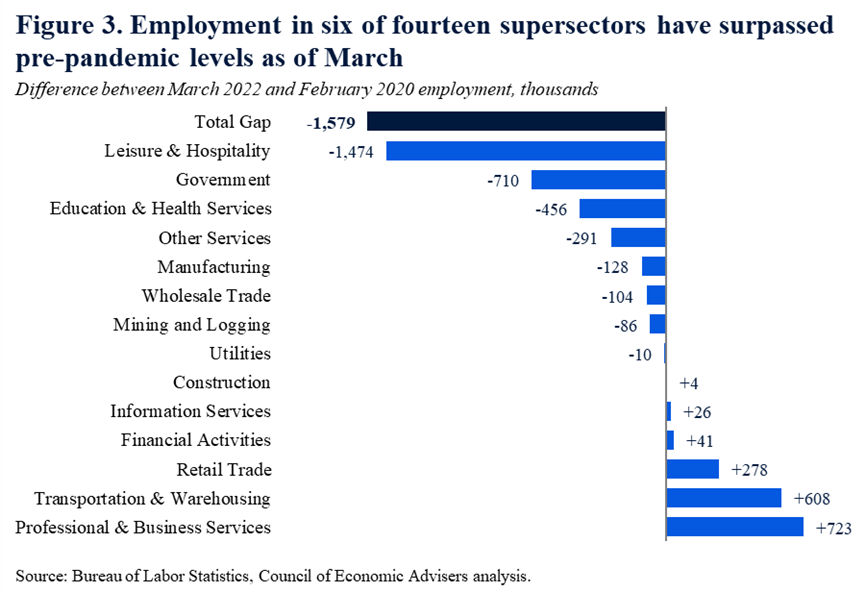
Source: CEA, April 1, 2022.
Leisure and hospitality employment is 1.6 million jobs below NBER peak levels.
That being said, nowcasts for 2022Q1 indicate subdued growth: GDPNow is 1.5%, while IHS MarkIt tracking indicates 0.2% (both 4/1).
Am I telling a political story based on noisy figures pulled from some government bureaucrat’s lower orifice, placing blind faith in data gathered by others, and completely ignoring the uncertainty of revisions?
NO, rsm, you are not telling “a political story.” You are telling no story at all. All you are doing is repeating your old claim that nobody can say anything about anything based on reported data because it is so uncertain. Nobody should say anything at all. We should all just wander around saying absolutely nothing and behaving in just completely arbitrary and random ways because we know nothing.
Amirite?
Average hourly earnings gains, while still good in nominal terms, are not as fast as in the 6 months to January. After accounting for inflation, wage gains aren’t gains.
Typically, hiring slows markedly ahead of recession. Hiring is still way above average for non-recessionary periods, much less for periods just before recession. Hard to have a recession when new incomes are being added at this pace.
Retail trade and transportation up – no surprise. But the big winner is professional and business services? OK the lawyers are having a field day cleaning up the Trump mess while Big Four accounting is busy with more tax evasion by multinationals.
about half of “professional and business services” includes janitors and those working for employment agencies…that said, the March summary says “Job growth continued in professional and business services, which added 102,000 jobs in
March. Within the industry, job gains occurred in services to buildings and dwellings
(+22,000), accounting and bookkeeping services (+18,000), management and technical
consulting services (+15,000), computer systems design and related services (+12,000),
and scientific research and development services (+5,000). Employment in professional
and business services is 723,000 higher than in February 2020.” so the March jobs increase did lean towards professional and technical services…
Off topic, but my current obsession –
The change in monthly mortgage payments are sensitive not tothe level of mortgage rates, but to the change in rates. Here is the change in 30-year mortgage rates, expressed (I believe) so as to best indicate the impact on monthly payments:
https://fred.stlouisfed.org/graph/?g=NLuQ
The last time something like this happened was in 1980. Back then, it was Fed-and-inflation-driven. Same now, but with the kicker of starting at very low rates, so that the impact on mortgage payments of a 1% rise in rates is much larger. Less inflation and less Fed tightening for the same effect.
We’re back (?) !
_ _ _ _ _ _ _ _ _ _ March 2022 _ Q-1 2022 _ Pre-COVID avg
Unemployment _ _ _ _ 3.6% _ _ _ _ 3.8% _ _ _ _ 5.7%
=> Over 20 yrs _ _ _ _ 3.5% _ _ _ _ 3.9% _ _ _ _ _5.0%
=> 16-19 yrs _ _ _ _ _ _9.7% _ _ _ _10.6% _ _ _ _16.1%
=> 20-24 yrs _ _ _ _ _ _ 7.7% _ _ _ _7.8% _ _ _ _ _9.3%
=> 25-54 yrs _ _ _ _ _ _ 3.2% _ _ _ _ 3.6% _ _ _ _ 4.6%
=> Over 55 yrs _ _ _ _ _2.8% _ _ _ _ 3.1% _ _ _ _ 3.8%
Participation rate _ _ _64.3% _ _ _ _64.1% _ _ _ 64.1%
fwiw, i have two months real PCE adding 2.69 percentage points to the growth rate of the 1st quarter, using tables 7 & 8 from the February income and outlays report, which will be transferred without alteration to the GDP report after any later revisions: https://www.bea.gov/sites/default/files/2022-03/pi0222.pdf
two months of construction spending is falling at a rate that would subtract about 0.22 percentage points from 1st quarter GDP, with the caveat that i’ve deflated with the producer price index for final demand construction, which is a very inexact shortcut…. using exhibit 10 in Tuesday’s trade report, which shows monthly exports and imports of goods in 2012 dollars, https://www.bea.gov/sites/default/files/2022-04/trad0222.pdf i figure the net effect of our international trade in goods will be to subtract around 1.99 percentage points from 1st quarter GDP….our trade in services deficit increased both months too, but i don’t have a handy deflator for that….meanwhile, Monday’s factory inventories showed the value of finished goods inventories increased 0.6% in February, the value of work in process inventories increased by 0.7%, and the value of materials and supplies inventories increased by 0.6%…the producer price index for February showed prices for finished goods increased 2.4%, that prices for intermediate processed goods were 2.7% higher, and that prices for unprocessed goods were on average 14.6% higher, with even core raw materials averaging a 1.4% price increase….hence, real factory inventories appear to be down significantly (i don’t estimate a percentage point contribution to GDP from inventories cause i always get it wrong…)