You have to be careful in determining which series you’re looking at. Here are four measures of m/m PPI inflation (latest release, discussed here).
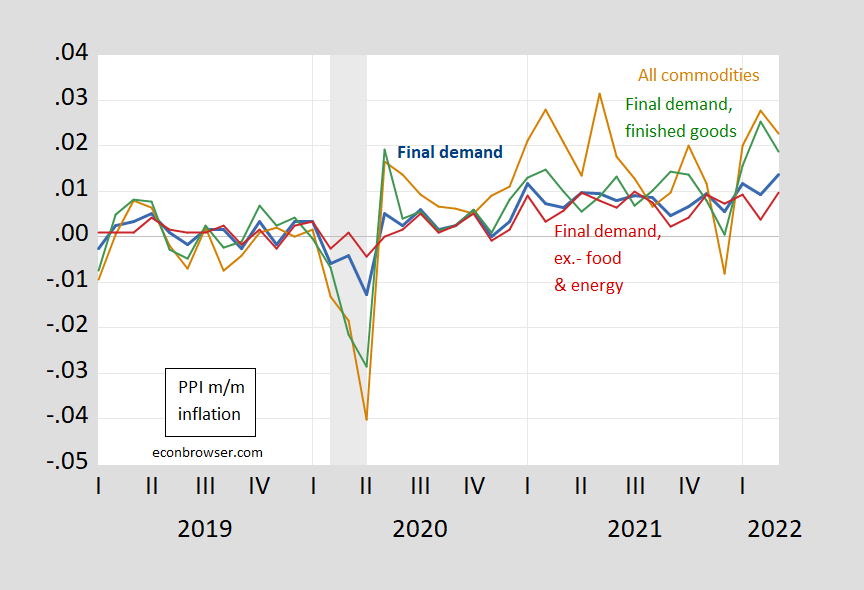
Figure 1: Month-on-month inflation (not annualized) for PPI for final demand (blue) [FRED series PPIFIS], PPI for all commodities (brown), PPI for final demand, finished goods (green), PPI for final demand excluding food and energy (red). NBER defined recession dates peak-to-trough shaded gray. Source: BLS, NBER, and author’s calculations.
FRED series PPIACO is a series that extends back to 1913. For those of us who went to learned about the PPI in the 1980s and 1990’s, this series is what was referred to — a goods only measure. In exchange rate determination papers I wrote in the 1990’s, for instance, I would use the PPI as a proxy measure for tradables goods prices, and CPI for nontradables.
One important aspect of this PPI measure is that it includes prices at different stages of production; hence there is multiple counting of the same product at different stages (e.g., intermediate vs. final).
Core measures are not straightforwardly identified, particularly if one is averse to reading the explanatory notes (or just averse to reading in general). When looking at indices excluding energy and food, there are (at least) a couple of measures that behave quite differently.

Figure 2: Month-on-month inflation (not annualized) for PPI for final demand excluding food and energy (blue) [FRED series PPIFES], PPI for final demand finished goods excluding food and energy (pink). NBER defined recession dates peak-to-trough shaded gray. Source: BLS, NBER, and author’s calculations.
So, be sure you know which PPI you’re looking at (and that other people are referring to). FRED series PPIFIS and PPIFES (final demand and final demand ex-energy and food) are the most commonly cited (a hint is that the folks running FRED have given specific mnemonics to them, and Bloomberg surveys reference these two series).
https://fred.stlouisfed.org/graph/?g=OdrS
January 15, 2018
Personal Consumption Expenditures price indexes for goods and services, 2017-2022
(Percent change)
https://fred.stlouisfed.org/graph/?g=OeBX
January 15, 2018
Personal Consumption Expenditures price indexes for goods and services, 2017-2022
(Indexed to 2017)
The respite from sub-$100 oil may be over, even with the SPR release and China’s decrease of 900 bpd. WTI is now trading at $105 and Brent at $110.
And then there’s housing…NewDealdemocrat: “ Unfortunately, even after the record surge in house prices was in full swing over a year ago, the Fed stayed on the sidelines. Now rents, and owners’ equivalent rents, are surging as well, and the Fed has only made one 1/4 point rate hike. Now the Fed is almost certainly going to stomp on the brakes, with a hard landing to follow.”
https://angrybearblog.com/2022/04/march-consumer-inflation-part-2-i-told-you-so#more-88204
Seriously, does anyone think the price surveys have the kind of precision implied by economists who have no idea how the data is gathered? What are the error margins? What is the non-response rate?
Why does Elon Musk say he doesn’t care about economics? Are economists simply too dismal for the world’s richest human?
You don’t really explain what the differences are between them…
The differences between consumer price increases imagined to be “normal” or “to be expected”~~sold by main stream media that benefit from those same consumer price increases, and the true increases in production costs are quite different. Often corporations have become so comfortable their screwing over of the American consumer to be so unthreatened in general culture, and bolstered by “news” media getting advertising kickbacks to MSM, they literally brag about it in their annual reports and earnings conference calls:
https://www.pbs.org/newshour/show/why-corporations-are-reaping-record-profits-with-inflation-on-the-rise
This used to be called price gouging before guys like Milton Friedman and Martin Feldstein figured out you could get on TV more, acquire cushy Republican advisory jobs, and large columns in the WSJ editorial section much easier and more often by labeling price gouging as American as Ben Franklin, Harper’s magazine, and apple pie.