The annual benchmark revision (release) made substantial changes to the level of reported GDP — but not to the growth rate in 2022H1– while GDO is revised slightly down as GDI is revised downward. Final sales to private domestic purchasers, a measure of domestic demand, revised up and rises.
First GDO, in constant dollars:
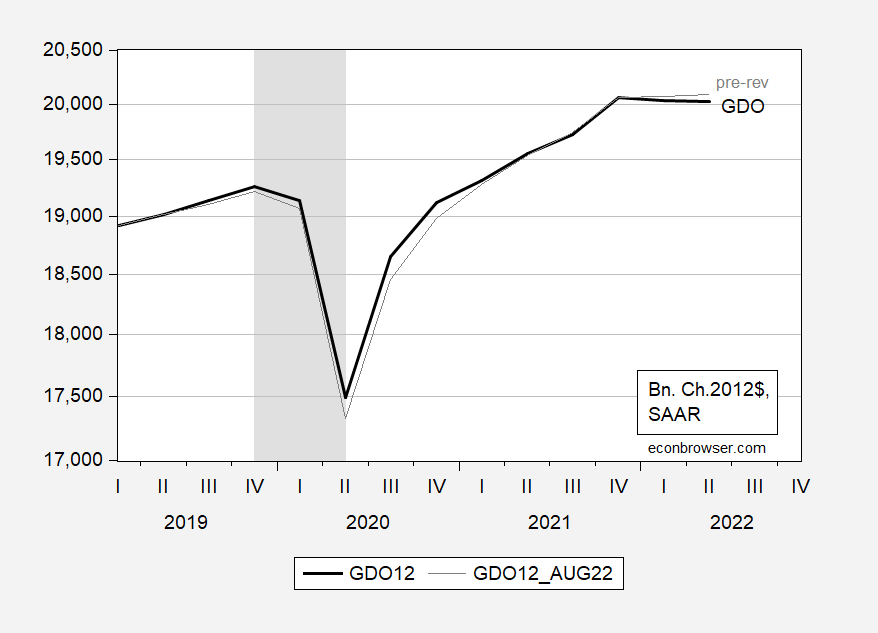
Figure 1: Gross Domestic Output (bold black), pre-annual benchmark revision (gray), both in billions Ch.2012$, SAAR. NBER defined peak-to-trough recession dates shaded gray. Source: BEA, BEA via ALFRED, NBER, and author’s calculations.
GDO declines 0.4% and 0.3% q/q annualized in Q1 and Q2 respectively. The relative lack of change in the level is due to offsetting movements in the levels of GDP and GDI:
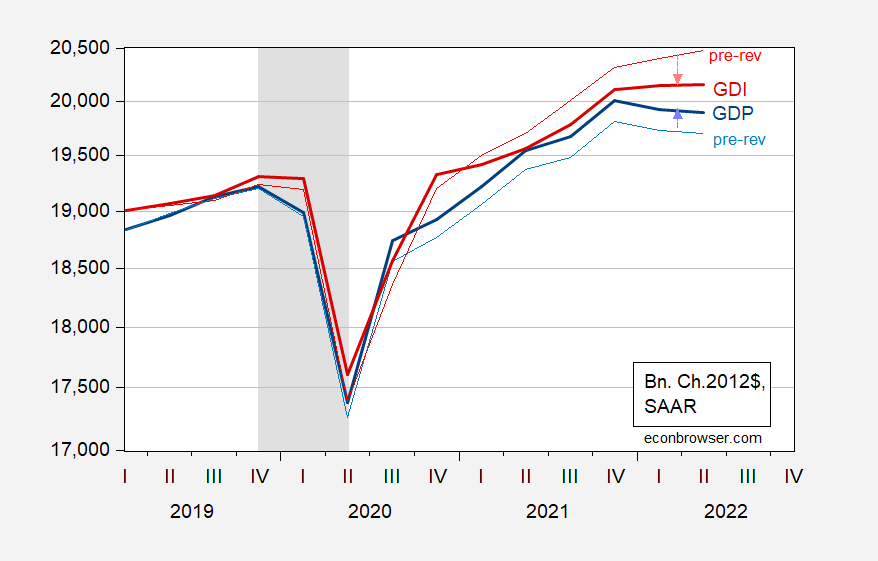
Figure 2: GDP (bold blue), pre-annual benchmark revision (light blue), GDI (bold red), pre-annual benchmark revision (light red), all in billions Ch.2012$, SAAR. NBER defined peak-to-trough recession dates shaded gray. Source: BEA, BEA via ALFRED, NBER, and author’s calculations.
The level of GDP was moved up, while GDI went the other direction, and flattens out from 2021Q4. This means the reported gap between GDI and GDP shrinks to more normal levels. Revision in GDP and GDI both accounted for roughly half of the revision, as shown below:
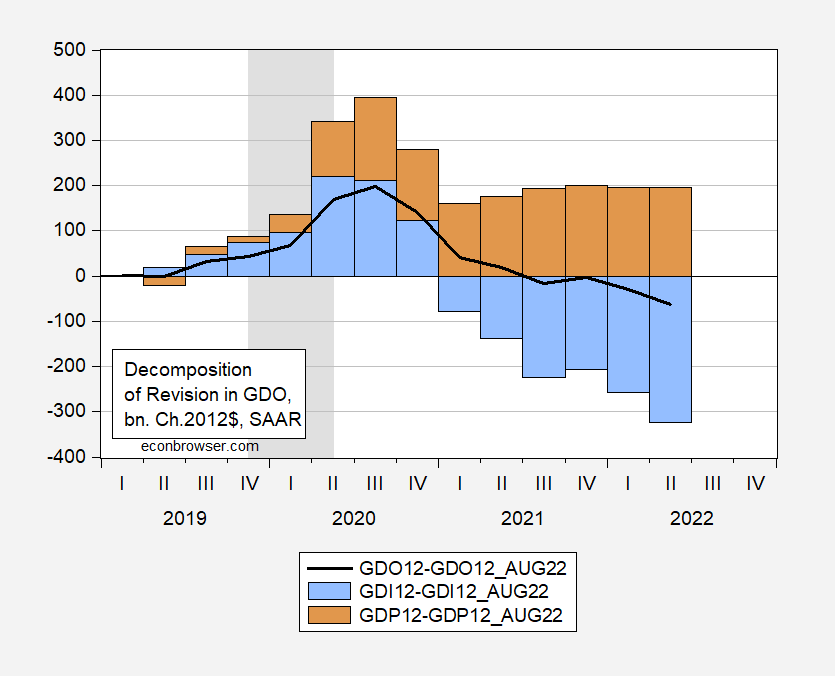
Figure 3: Revision in Gross Domestic Output (bold black), contribution due to GDP (tan bar), due to GDI (light blue), all in billions Ch.2012$, SAAR. NBER defined peak-to-trough recession dates shaded gray. Source: BEA, BEA via ALFRED, NBER, and author’s calculations.
From the release:
Real GDI is now estimated to have increased 0.8 percent in the first quarter (table 1); in the previously published estimates, first-quarter GDI was estimated to have increased 1.8 percent. The leading contributor to the downward revision was compensation, based primarily on new first-quarter wage and salary estimates from the Bureau of Labor Statistics’ Quarterly Census of Employment and Wages. The average of real GDP and real GDI is now estimated to have decreased 0.4 percent in the first quarter; in the previously published estimates, the average of GDP and GDI was estimated to have increased 0.1 percent.
While GDP is moved up in level, the recent decline in GDP over the last two quarters remains. It’s important to recall that GDP includes inventory accumulation, some of which might be desired, some of which might not. One can strip out inventory accumulation to obtain final sales.
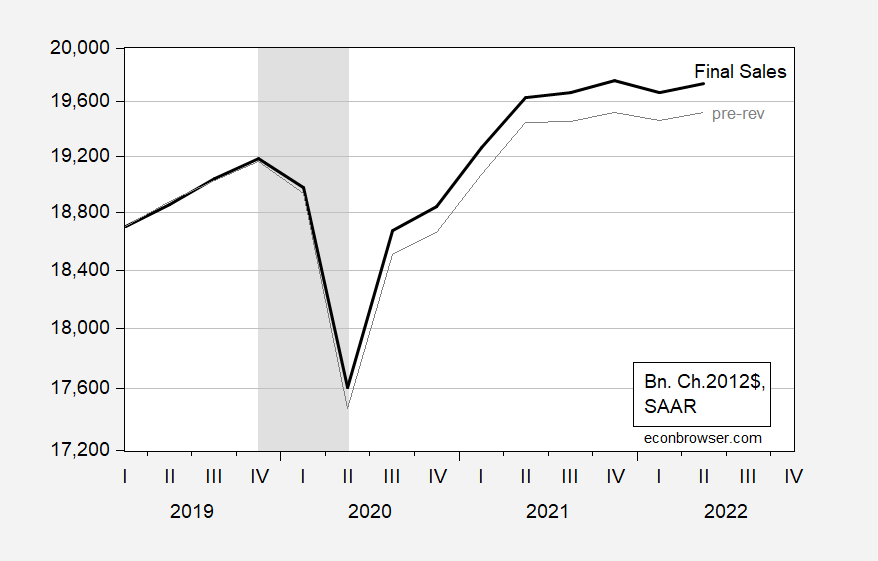
Figure 4: Final Sales (bold black), pre-annual benchmark revision (gray), both in billions Ch.2012$, SAAR. NBER defined peak-to-trough recession dates shaded gray. Source: BEA, BEA via ALFRED, NBER, and author’s calculations.
Final sales (to foreign as well as domestic) increased in Q2, while trending sideways since 2021Q2. Final sales to private domestic purchasers — sometimes taken as a measure of domestic private aggregate demand — shows a similar pattern.
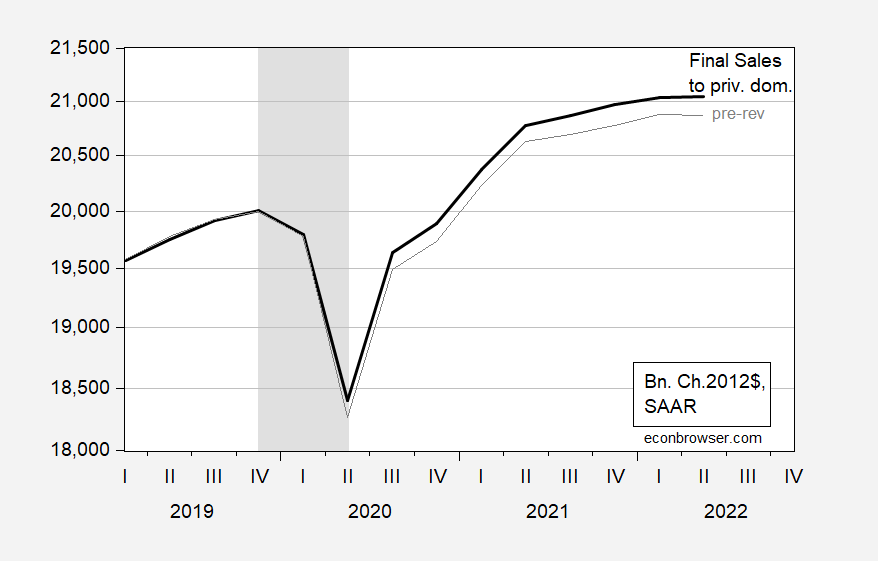
Figure 5: Final Sales to private domestic purchasers (bold black), pre-annual benchmark revision (gray), both in billions Ch.2012$, SAAR. NBER defined peak-to-trough recession dates shaded gray. Source: BEA, BEA via ALFRED, NBER, and author’s calculations.
Private domestic final sales shows a more sustained increase over time, albeit slowing to 0.2% q/q annualized in Q2.
The single biggest factor in pushing up GDP is consumption.
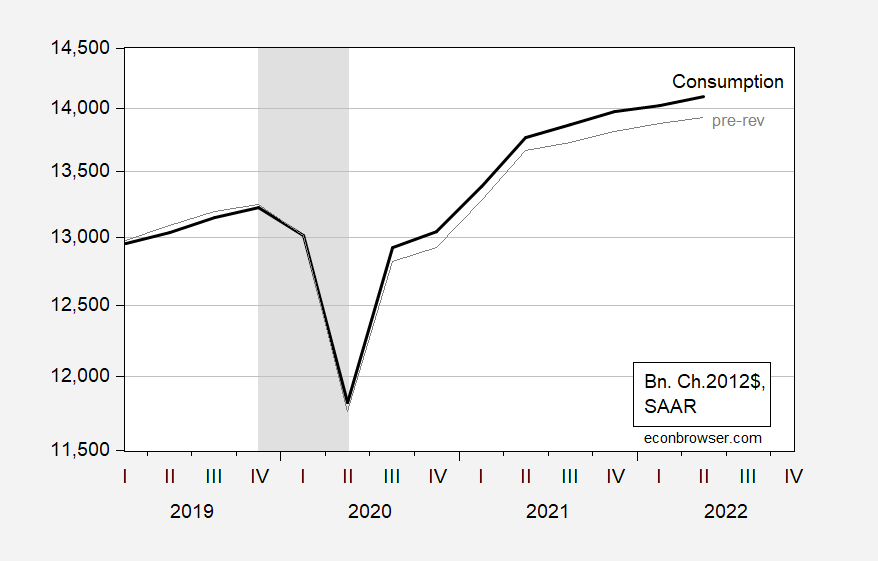
Figure 6: Consumption (bold black), pre-annual benchmark revision (gray), both in billions Ch.2012$, SAAR. NBER defined peak-to-trough recession dates shaded gray. Source: BEA, NBER, and author’s calculations.
Wildly off topic, relative returns to stocks and bonds –
The UK’s latest financial troubles got me thinking about duration risk and the adjustments in relative returns between asset classes. The long end of the UK soveriegn debt market plunged because that’s where the greatest risk from bad economic management resides – reflected in duration risk.
The U.S curve is inverted between twos and tens:
https://fred.stlouisfed.org/series/T10Y2Y
That’s a reflection of the expected cost of funds over different periods – the average cost of funds is higher in the near term than over ten years. Apparently, you actually still lose a bit on term premium for twos vs tens:
https://fred.stlouisfed.org/series/T10Y2Y
That term premium inversion means less priced-in risk in holding tens than in holding twos – that has often been the case in recent years, but is still odd. An inverted term premium in the U.S. is a vote of confidence, or sorts, in U.S. economic management.
So much for fixed income, but what about equities? Take a look at dividend yield for the S&P500:
https://ycharts.com/indicators/sp_500_dividend_yield
At mid-year, the yield for the index was 1.69%, historically low, but rising as equity prices fall. Two-year notes, meanwhile, are yielding above 4%. Prior to the Covid collapse, dividend yield was running 20 to 40 basis points higher than two-year yields. That seems to me bad news for the stock market. Not all shares are held for dividend yield, so not all shares need to be competitive on a yield basis with Treasuries. However, the other main reason is capital gains and equities have been producing capital losses.
This strikes me as another adjustment problem. Until equities return to a more normal yield relationship to bonds – when something like a third of S&P shares produce higher yields than twos – shifting from equities to Treasuries makes sense. So far this year, both assets have produced losses, but once Fed rate hike expectations settle down, Treasury losses should stop. Equities need to adjust to changing Fed rate hike expectations and to high two-year Treasury yields.
This view, while in some ways similar to the “Fed model” for equilibrating ten-year yields and forward earnings, gives a very different view of stock valuation. The Fed model currently has stocks under-valued. That’s because the curve is inverted, is my guess.
Real income has been basically flat this year – no matter how measured.
This year? Median usual weekly real earnings are up less than 7% in the 40+ years that FRED has been reporting the data.
https://fred.stlouisfed.org/series/LES1252881600Q
Of course, pgl has never been real swift on the uptake when it comes to understanding what’s happening average Americans’ incomes.
Well, let’s set this aside and get back to what’s really important– whether GDP is up 0.3% or down 0.3%…or maybe we could obsess about how many angels can dance on the head of a pin!
Johnny? Remember when you insisted that a series on median weekly income didn’t even exist, and you claimed that was evidence that economists don’t care about workers’ income? We had to show you it does exist, and now, you’re pretending to be an expert. And pretending to know what other people understand, when you have demonstrated repeatedly that you don’t know enough to know what other people understand. Johnny, you are not the sharpest knife in the drawer.
So median weekly income is up about 7% from an arbitrary point in the past till now. It was also up 26% from the lowest point in that period to the highest. And median personal income has risen 42% over roughly the same period. Lots of numbers out there, Johnny. Your point is…?
Your focus on a single measure, which you once claimed didn’t exist, is certainly good evidence you don’t understand much about average Americans’ incomes. That’s not surprising, since your paycheck, as far as anyone can tell, comes from Russia.
But but but – this is all my fault somehow. New post up calling out Johnny over the Ukraine situation.
MacroDuck makes his case using the lowest point to the highest point in a data series! Maybe he should try selling stocks?
And median personal income? No attribution or source data, of course. But much of the increase could be explained by the rise in dual income households, which helped compensate for stagnating men’s wages.
Bill Clinton, 1992: “The American dream that he grew up with, Clinton said in a typical line from his stump speech, had been shattered for millions of Americans. “The idea,” he said, “that if you worked hard and played by the rules you’d be rewarded, you’d do a little better next year than you do last year, and your kids will do better than you — that idea has been devastated.”
MacroDuck, 2022: Wages stagnating, but don’t worry, be happy.
Hey worthless troll. The discussion was clearly about real GDP and real GDI which I just happened to label real income. Now if you want to start a NEW discussion about the distribution of income – fine. But have the decency to be clear you are bringing up a new topic. Otherwise – take your worthless whining somewhere else.
“The annual benchmark revision (release) made substantial changes to the level of reported GDP — but not to the growth rate in 2022H1– while GDO is revised slightly down as GDI is revised downward.”
Johnny reads this and thinks the topic was real wages. Yea – he is indeed the dumbest and most worthless whiny loud mouth God ever created.
“pgl has never been real swift on the uptake when it comes to understanding what’s happening average Americans’ incomes.”
No one understands WTF you just said. You do have serious emotional problems but dude – I’m not the cause of them. So bugger off troll.
https://www.msn.com/en-us/news/politics/russian-oil-tycoon-oleg-deripaska-charged-with-violating-u-s-sanctions/ar-AA12oY9R?ocid=msedgdhp&pc=U531&cvid=f2c8ff6aa00f42398430c08ba2eecbac
Russian oil tycoon Oleg Deripaska has been indicted by a federal grand jury in New York for allegedly violating U.S. sanctions imposed against members of Russian President Vladimir Putin’s inner circle, authorities said Thursday.
Russian oil tycoon Oleg Deripaska has been indicted by a federal grand jury in New York for allegedly violating U.S. sanctions imposed against members of Russian President Vladimir Putin’s inner circle, authorities said Thursday. Deripaska, a longtime associate of former Donald Trump campaign chairman Paul Manafort, was among two dozen Russian oligarchs and officials who were sanctioned by the Treasury Department in April 2018.
A Russian oil tycoon cheating on the sanctions is no surprise. That this tycoon is an associate of Trump and his mob – Figures. But then this?
A news release announcing the sanctions said Deripaska has been investigated for money laundering and accused of “threatening the lives of business rivals, illegally wiretapping a government official, and taking part in extortion and racketeering.”
Actually the mob boss is Putin and Trump is his number one.
Here is a fresh tidbit out of Russia that has not yet appeared in western media.
Apparently, a bit like in US in Civil Wat, one can buy one’s way out of being conscripted. The going price is apparently 5000 euros, yes, euros, not rubles or rmb or USD (and definitely not the British pound), with the actual exchange rate between the ruble and the euro much worse than the official rate. Not clear what the legal status of this is, but apparently it is seriously for real.
Yeah, so it begins. My guess 2022 gets revised up next year though not as much. Consumption was stronger than thought in 2020-21………can’t wait to see this in 8 years.
This may be misguided or even an ignorant question, but is it possible that the economy is hitting some kind of upper bound based on availability of labor?
“The average of real GDP and real GDI is now estimated to have decreased 0.4 percent in the first quarter.
This is bad news for folks who were counting on GDI pulling up GDO to a positive number. That’s two quarters of negative GDO. Note that GDO (the average of GDP and GDI) is the metric favored by the NBER to determine quarter dates for recessions.
With recession on the horizon for the UK and EU and big decline in China, two quarters of GDO decline, two months of zero CPI — its time that Powell stops being intimidated by the screeching inflationistas pauses the tightening.
Not an ignorant question. The odd thing is that at our current very low unemployment rate, job growth has been quite rapid. In theory, new workers should be scarce. Skills are scarce, but there are enough workers to allow for above average new job growth since the end of the Covid recession.
There is a quirk in the unemployment rate which helps explain some of the oddity of rapid hiring despite low measured unemployment- it’s the measurement part. One is not counted as unemployed unless one is actively looking for work. In the current labor market, lots of people find work so rapidly when they want a job that they never get counted as looking for a job. If you look instead at the employment rate, which doesn’t involve looking for work, you’ll see that there are still a good many working-age people not currently working:
https://fred.stlouisfed.org/series/LREM64TTUSM156S
The recent rate of hiring and the employment rate both suggest we have not run into a problem of there not being enough workers. It’s a tougher labor market for employers than they are accustomed to, but there are still working-age people who can be pulled into jobs if the offer is right. The worry now is that demand for workers could dry up very quickly.
Pretty wide confidence intervals, eh?