The recession is (probably) not here yet (nor was it likely here earlier this year), employment likely continued to grow, and real wages are on average higher than they were before the pandemic. First, key business cycle indicators followed by the NBER BCDC continue uptrend in October, with exception of the civilian employment series based on the household series.
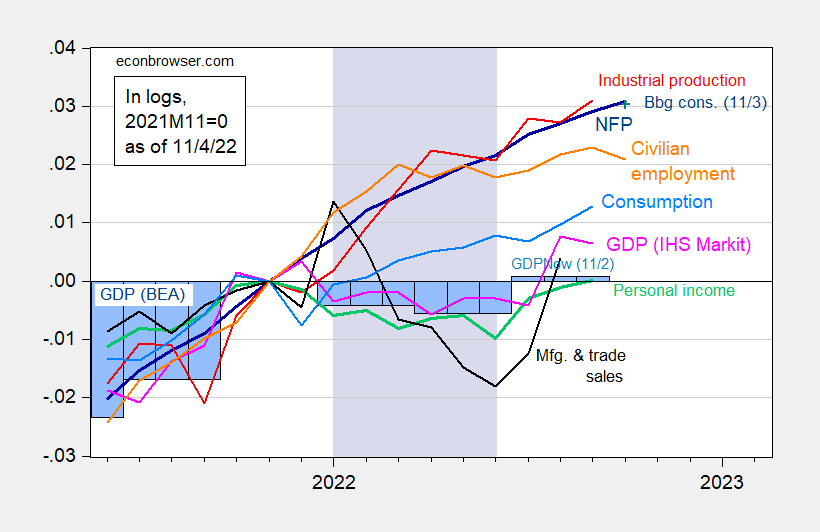
Figure 1: Nonfarm payroll employment, NFP (dark blue), Bloomberg consensus as of 11/3 (blue +), civilian employment (orange), industrial production (red), personal income excluding transfers in Ch.2012$ (green), manufacturing and trade sales in Ch.2012$ (black), consumption in Ch.2012$ (light blue), and monthly GDP in Ch.2012$ (pink), GDP (blue bars), all log normalized to 2021M11=0. Q3 GDP is from GDPNow for 11/1. Lilac shading denotes a hypothetical recession in 2022H1. Source: BLS, Federal Reserve, BEA, via FRED, IHS Markit (nee Macroeconomic Advisers) (11/1/2022 release), GDPNow (11/1) and author’s calculations.
Note that the NBER BCDC places primary emphasis on employment and personal income (and not necessarily GDP).
What about employment? Recall, the nonfarm payroll series is usually considered much more informative regarding the business cycle than the civilian employment series, and is less variable. However, the establishment series is also subject to sometimes substantial annual revisions, as more tax information comes in (e.g., from the Quarterly Census of Employment and Wages, QCEW). I have calculated the series implied from the preliminary benchmark revision (which applies to March 2022 data), and plotted it, alongside the official series, and the household series adjusted to conform to the nonfarm payroll concept.
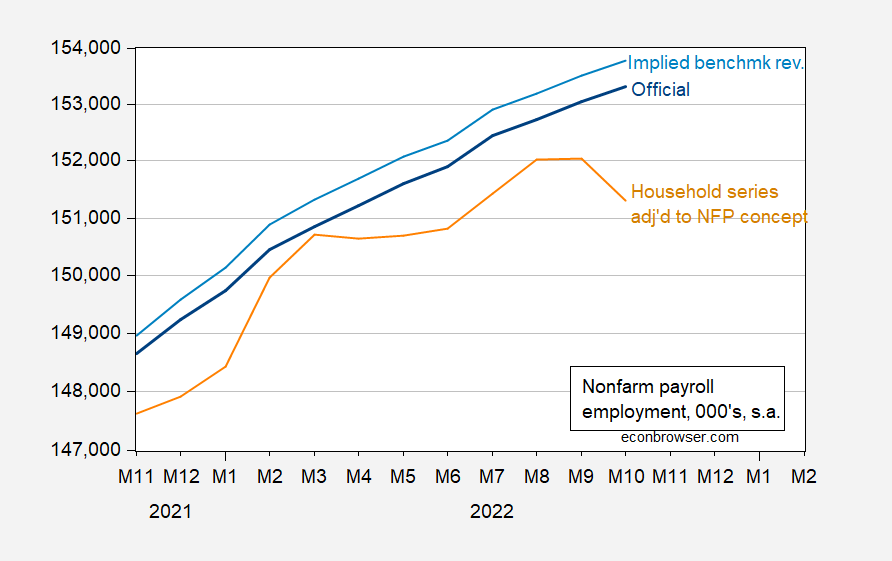
Figure 2: Nonfarm payroll employment (blue), implied benchmarked nonfarm payroll employment (light blue), and household survey employment adjusted to nonfarm payroll concept (tan), all in 000’s, s.a. Source: BLS via FRED, BLS, and author’s calculations.
Notice the continuously upward trajectory in the establishment series. While the household series flatten in the 2022H1, in the aggregate and adjusted to the NFP concept, the 2022M06 value is higher than the 2022M01 value. These observations suggest no recession in 2022H1, nor an ongoing recession (although — informally — a decline in the household series does seem to better presage a recessions with greater lead time than the establishment series).
There has been much commentary on the decrease in real wages over the past year. Figure 3 illustrates the decline in the CPI adjusted wage for nonsupervisory jobs in the private sector.
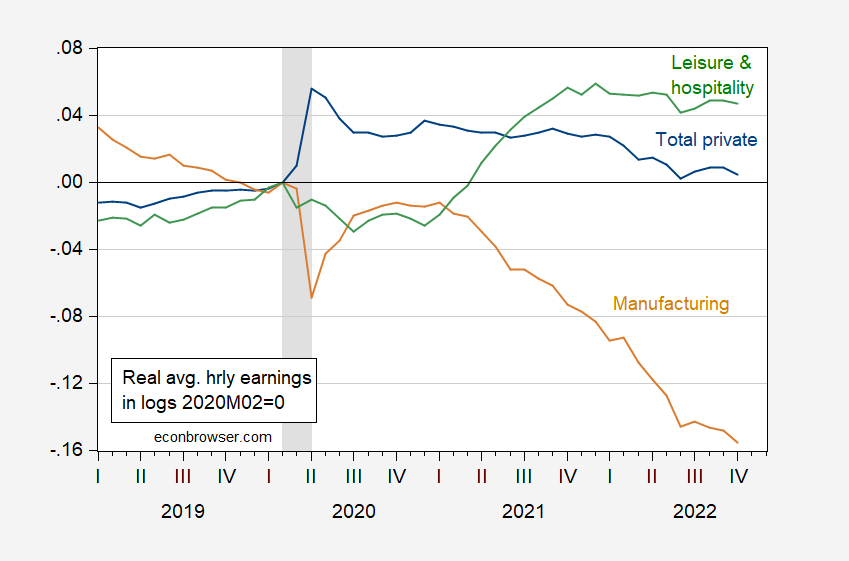
Figure 3: CPI deflated hourly wages, for total private (blue) manufacturing (tan), and leisure and hospitality (green), for nonsupervisory nonmanagerial jobs, in logs 2020M02=0. NBER defined peak-to-trough recession dates shaded gray. October CPI estimated using Cleveland Fed nowcast as of 11/4. Source: BLS via FRED, Cleveland Fed, NBER, and author’s calculations.
Notice that real average hourly earnings for leisure and hospitality workers have increased — and remained high — relative to pre-pandemic levels. Those interested in the equity aspects of the restructuring of the labor markets should take note. On the other hand, manufacturing has decreased nearly 16% relative to pre-pandemic levels. Presumably, some of this is driven by the strong dollar.
“Notice the continuously upward trajectory in the establishment series. While the household series flatten in the 2022H1, in the aggregate and adjusted to the NFP concept, the 2022M06 value is higher than the 2022M01 value.”
I look forward to a thorough analysis of why these two series diverged. Of course what we will likely get from those RECESSION CHEERLEADERS will hype the Kudlow nonsense on the reliability of the household survey.
“Notice that real average hourly earnings for leisure and hospitality workers have increased — and remained high — relative to pre-pandemic levels. Those interested in the equity aspects of the restructuring of the labor markets should take note. On the other hand, manufacturing has decreased nearly 16% relative to pre-pandemic levels. Presumably, some of this is driven by the strong dollar.”
Two good points. But wait for it – another episode of JohnH’s soap box telling us economists do not care about the working man.
https://cepr.net/jobs-2022-11/
Dean Baker notes which sectors have seen employment increases since the pandemic v. which sectors are still lagging. He also states:
Perhaps most importantly, it seems wage growth is settling down to a level consistent with the Fed’s 2.0 percent inflation target. Over the last three months, it has increased at a 3.9 percent annual rate. That compares to a 3.4 percent rate in 2019, when inflation was comfortably below the Fed’s target.
https://www.spglobal.com/marketintelligence/en/news-insights/latest-news-headlines/us-private-auto-combined-ratio-rises-above-100-in-2021-70095560
I’ve been doing some catching up on insurance pricing and came across this discussion of the “combined ratio” for automobile insurance companies, which are whining about operating losses in 2021. Of course they had operating profits for 2018, 2019, and 2020.
What is the combined ratio? Well it adds the payments insurance made on your behalf (labeled losses) relatives to the premiums we pay plus the insurance company’s operating expenses relative to premium. The chart for each insurance company shows high incredibly high operating expenses are. So insurance companies tend to be somewhat bloated and yet they earn operating profits on average.
BTW – I did not know until now that Warren Buffett’s Berkshire Hathaway owns GEICO. I wish Warren would get rid of that obnoxious lizard doing their commercials.
Leave it to RonJon to run a racist campaign!
https://www.msn.com/en-us/news/politics/how-republicans-racist-attack-ads-wiped-out-democrat-s-lead-in-wisconsin/ar-AA13JGkI?ocid=msedgdhp&pc=U531&cvid=91ecd92a9e9c4a02a208972779288e3a
After months of flinging mud, Senator Ron Johnson was finally obliged to admit that his Democratic opponent in the upper midwestern state of Wisconsin had never actually made a call to “defund the police”. But that did not stop the Trumpist senator’s re-election drive from continuing to broadcast racially charged advertisements falsely claiming that Mandela Barnes, the lieutenant governor of Wisconsin, “rationalized violence” against the police and tying him to the most controversial positions of Black Lives Matter.
But it is not just the racists in Wisconsin. Lee Zeldin in New York and his fellow Republicans are claiming Kathy Hochul actually likes dangerous criminals. Yes crime rose in large part because we had a racist demogogue in the White House from 2017 to 2020, Republicans stroke fear and violence, an incompetent initial response to the pandemic, and of course all those guns Zeldin wants on our subways.
My solution to high crime – depart anyone wearing a MAGA hat.
The decline in real hourly earnings for the factory sector (Figure 3) is at least partly a compositional issue:
States with the highest median annual manufacturing wage
#1. District of Columbia: $62,020
#2. Wyoming: $49,070
#3. Alaska: $47,440
#4. North Dakota: $46,930
#5. Washington: $46,550
States with the lowest median annual manufacturing wage
#1. Alabama: $36,090
#2. Mississippi: $36,130
#3. Arkansas: $36,190
#4 (tie). Delaware: $36,360
#4 (tie). Florida: $36,360
#4 (tie). Georgia: $36,360
https://www.citizentribune.com/news/state/what-manufacturing-workers-make-in-tennessee/collection_bf1c3b4a-ecb8-5fb4-aa77-b96c8ba92e60.html#1
D.C factory employment 0% y/y as of September
Wyoming factory employment 0%.
Alaska factory employment -16.6%
North Dakota factory employment up 3%.
Washington factory employment up 4.5%.
Mississippi factory employment up 3.0% y/y as of September.
Arkansas factory employment up 4.5%.
Delaware factory employment up 4.8%.
Georgia factory employment up 4.6%.
Florida factory employment up 7.3%.
https://www.bls.gov/eag/home.htm
It’s pretty clear that much of the growth in factory employment has been in low wage states.
So here’s a graph which provides some insight into the productivity puzzle.
https://twitter.com/BrettMatsumoto/status/1587251536278814722
The data shows a surge in productivity at the beginning of the pandemic and a decline into 2022. This may make some intuitive sense, in that the pandemic may have disproportionately affected workers in lower wage occupations. Therefore, productivity soared as these workers went into lockdown. This process was then reversed in late 2021 and early 2022 as lower wage workers returned to their jobs, thus bringing productivity back on long term trend.
https://english.news.cn/20221104/8c17947d13c84157914a73ce960a08b6/c.html
November 4, 2022
China’s current account surplus up 56 pct in first 3 quarters
BEIJING — China’s current account surplus stood at a record 310.4 billion U.S. dollars in the first three quarters of 2022, up 56 percent year on year, official data showed Friday.
The ratio of the current account surplus against the gross domestic product of the same period was 2.4 percent, which is within a reasonable and balanced range, said the State Administration of Foreign Exchange.
Of the total, the surplus under trade in goods increased 37 percent year on year to hit a record 521.6 billion U.S. dollars, while the deficit under trade in services narrowed by 23 percent, the data showed.
Direct investment logged a net inflow of 46.9 billion U.S. dollars, according to the administration….
https://english.news.cn/20221103/4aebc91eef3d42e28d424015485b23b4/c.html
November 3, 2022
Import expo boosts China’s high-standard opening up
* The fifth China International Import Expo (CIIE) will open on Nov. 5 in China’s economic hub Shanghai.
* Official data show a total of 145 countries, regions and international organizations will partake in this year’s expo.
* As the first major international expo held in China since the 20th National Congress of the Communist Party of China, the fifth CIIE once again demonstrates that China is committed to its fundamental national policy of opening to the outside world and pursues a mutually beneficial strategy of opening up.
SHANGHAI — Andreas Thorud is putting the finishing touches to a seafood-themed booth at the fifth China International Import Expo (CIIE), scheduled for Nov. 5 to 10 in China’s economic hub Shanghai.
“We are very happy and excited to be part of this fifth edition of the CIIE,” said Thorud from the Norwegian Seafood Council, a first-time CIIE exhibitor.
According to Thorud, eight Norwegian companies, led by the seafood council, will be joining the upcoming event. They will be promoting a variety of star seafood specially selected for the Chinese market, including Norwegian salmon, shellfish and king crab.
The past few years have been full of opportunities for global exporters, as China’s appetite for seafood has grown continually. It was this fact that prompted Thorud and his peers to gravitate to the CIIE.
This year’s CIIE is going to be a very exciting platform “for us to see how we can develop new areas, new business partners and new types of consumers,” Thorud said.
OPEN MARKET …
“ Why the Pentagon Is the World’s Biggest Single Greenhouse Gas Emitter… Although the Pentagon has been at the forefront of climate change research since the mid-20th century, Crawford writes, the US Department of Defense is also the single largest institutional fossil fuel user in the world. Since 2001, the military has been responsible for 77 to 80 percent of federal energy consumption.”
https://www.motherjones.com/environment/2022/10/pentagon-climate-change-neta-crawford-book/
“Since 2001, the military has been responsible for 77 to 80 percent of federal energy consumption”.
Of course DoD is responsible for most of Federal purchases. Federal transfer payments may be the largest portion of Federal expenditures but come on. Understand what such ratios really mean.
Crawford is quoting Senator Markey:
https://www.markey.senate.gov/news/press-releases/senator-markey-and-rep-jones-lead-colleagues-in-calling-to-ensure-defense-department-is-accountable-for-climate-pollution-emissions#:~:text=%E2%80%9CSince%202001%2C%20the%20military%20has,emissions%20come%20from%20the%20DOD.
I am a big fan of Markey and his proposals are spot on. But that quote really should have been put in better context.
Check out Markey’s quote including the next sentence:
“Since 2001, the military has accounted for 77 to 80 percent of federal energy use. According to the White House’s December 2021 Federal Sustainability Plan, 56 percent of federal government emissions come from the DOD.
Wait emissions are only 56% while energy use is 80%? So the DoD is closer to the goal than the rest of the Federal government. Context is everything but Johnny boy cannot be bothered with getting the full picture. Dude – we have been over this before and I guess you still do not get it.
“ China has been a global leader in shifting from fossil fuels to renewable energy, adding more renewable energy capacity than any other country. By the end of 2022, China is on pace to install an astounding 156 gigawatts of additional capacity provided by wind turbines and solar panels, which is 25 percent more than the record it set in 2021. By comparison, the United States is expected to install only about 30 gigawatts of solar and wind power this year.”
https://fpif.org/the-future-of-chinas-green-revolution/
Your story notes that China is also part of the problem:
‘China is the largest emitter of carbon dioxide in the world by a rather wide margin. In 2020, China was responsible for a little over 30 percent of annual carbon emissions. The share of the number two emitter, the United States, was about 13.5 percent. Factoring in all greenhouse gasses doesn’t change the picture very much, with China still number one at 26 percent and the United States number two at approximately half that figure.’
Of course neither this passage nor the one who noted put this into perspective by noting China’s population is four times the US population. Come on folks – can we at least try to express things in relative terms? Geesh!
China also happens to still be building new coal-powered power plants, about half those being built in the world, in contrast to the zero that the US is currently building.
China is a large nation after all. Which is why these comparisons should be done in per capita terms. After all New Zealand does not use a lot of coal in absolute terms.
BLS: “Earnings series from the monthly establishment survey Earnings series from the monthly establishment survey are estimated arithmetic averages (means) of the hourly and weekly earnings of all jobs in the private nonfarm sector of the economy, as well as of all production and nonsupervisory jobs in the private nonfarm sector of the economy. Average hourly earnings estimates are derived by dividing the estimated industry payroll by the corresponding paid hour are estimated arithmetic averages (means) of the hourly and weekly earnings of all jobs in the private nonfarm sector of the economy, as well as of all production and nonsupervisory jobs in the private nonfarm sector of the economy. Average hourly earnings estimates are derived by dividing the estimated industry payroll by the
corresponding paid hours.” https://www.bls.gov/news.release/realer.tn.htm
With the data just released there does not seem to be a way to calculate the median wage, which is what the average worker gets.
The disparity between the average wage and the median wage has been widening greatly for years. As the data from Social Security shows, thirty years ago the median wage was 70.9% of the average wage. In 2021 it was 64.66%. This trend reflects the rapid growth of wages for the top 5%, pushing the average upwards.
https://www.ssa.gov/OACT/COLA/central.html
https://www.epi.org/blog/wage-inequality-continued-to-increase-in-2020-top-1-0-of-earners-see-wages-up-179-since-1979-while-share-of-wages-for-bottom-90-hits-new-low/
Given this disparity, I’m not sure how much the “average wage” has much to tell us about the welfare and wellbeing of the average American worker, who earns the median wage.
https://fred.stlouisfed.org/graph/?g=rAbi
January 15, 2018
Real Median Weekly Earnings for men and women, * 2000-2022
* Full time wage and salary workers
https://fred.stlouisfed.org/graph/?g=T82W
January 15, 2018
Real Median Weekly Earnings for White, Black and Hispanic, * 2000-2022
* Full time wage and salary workers
https://fred.stlouisfed.org/graph/?g=lMaX
January 15, 2018
Real Median Weekly Earnings for men and women, * 2000-2022
* Full time wage and salary workers
(Indexed to 2000)
Observations from the Florida front.
Shopping activity seems high based on the “parking lot index” and traffic in commercial shopping districts. Tourist traffic is a bit off, but that may change in three weeks. Prices for gasoline about $3.50/gallon which corresponds to Georgia’s prices after adjusting for the gasoline tax suspension in Georgia. Overall attitudes seem business-as-usual with the exception of inflation grumbling. Politically, Charlie Crist didn’t have and still doesn’t have a chance here while Kemp is running all over Abrams in Georgia.
Presuming the 260+K new jobs is accurate, that’s a good news/bad news metric. Good news in that the economy seems to be growing moderately (based on that sole metric); bad news is that Jerome Powell will see that as a sign to remain aggressive with interest rates… increasing the likelihood of a recession on which everyone agrees?
Looks as if I left Michigan a week too soon. Could have picked up a couple more rounds of fall golf there. OMG! Global warming! Now I’m a believer of the rhetoric. Oh, wait, the forecast says lower 40s in a week and a half. Nevermind. Just weather.
The parking lot index? And I thought Princeton Steve was weird.
“Presuming the 260+K new jobs is accurate, that’s a good news/bad news metric. Good news in that the economy seems to be growing moderately (based on that sole metric); bad news is that Jerome Powell will see that as a sign to remain aggressive with interest rates… increasing the likelihood of a recession on which everyone agrees?”
Maybe you were too drunk on Budweiser to have noticed but the stock market rose on this news.
Counting cars in parking lots is a thing.
https://qz.com/1652293/how-to-make-money-with-rs-metrics-and-orbital-insight-space-data
By the way, this is the sort of thing the Fed should have at its fingertips for Nowcasting. Another is mobile telephone data. With that you could literally do real time GDP measurements across the globe. Last I checked, the Fed was grossly under-budgeted for this sort of thing. Maybe things are better today, but statistics are essential for the pros but mere curiosities for the average politician.
Steven Kopits: You truly are impervious to information, and apparently unable to use a search engine. You might find objective 1.2 (page 9) in the Board’s Information Resources Management Strategic Plan 2022. You might also want to consult my previous rejoinder on Econbrowser to your ignorant comment.
“Last I checked, the Fed was grossly under-budgeted for this sort of thing.”
When was this? 1982?
The only thing even remotely interesting in your little link here was that dog in the front right seat of that car. Was that dog you Stevie?
Apparently, an idle mind IS the devil”s playground! You might want to take up a hobby that doesn’t lead to “aw shucks” essays. Or any expression of opinion, for that, matter. Please, for the sake of your family, take up macreme.
Pardon my French but Marjorie Taylor Greene is one [edited – MDC] who has cheated on sugar daddy husband before and is still doing it. Of course Mr. Greene is getting the better of this deal as his soon to be ex-wife is one ugly piece of trash:
https://www.msn.com/en-us/tv/celebrity/gop-congresswoman-marjorie-taylor-greene-spotted-schmoozing-right-wing-reporter-weeks-after-husband-files-for-divorce/ar-AA13HEey
Marjorie Taylor Greene was spotted with a right-wing reporter despite the man denying the two were ever together, RadarOnline.com has learned. In photos taken exclusively by Daily Mail, the 48-year-old controversial GOP congresswoman was seen spending the day with Republican reporter Brian Glenn. According to the outlet, the photos of the pair “schmoozing” were taken last week while MTG was campaigning in her adopted hometown of Rome, Georgia. Glenn, who serves as program director for the online outlet Right Side Broadcasting Network, was seen in the series of photos climbing into Greene’s SUV before the pair had dinner at a local restaurant and then returned to the Georgia House Representative’s home. The photos of the two together also came just days after Glenn filed for divorce from his wife, although the right-winger denied he and Greene were entangled in a romantic affair. He also denied the two were together on last Thursday in Rome, Georgia. “My divorce has nothing to do with Marjorie Taylor Greene,” he told Daily Mail. “No, I do not have a romantic relationship with Marjorie Taylor Greene.”
I hope Glenn’s wife has a good divorce attorney as her soon to be ex-husband must be one stupid dude. Gag.
Hearing raunchy guitar riff from The Doors’ “Hello, I Love You” in my brain right now.
Taking wagers on the time length of this relationship/ starting now. 5 years is the over/under. I got the under. Let’s hear it from you right-wing cowards. Put up or shut up on Reagan’s and Newt’s “conservative” “family values”.
says a puritan living in brooklyn….
I’m taking the under. Marjorie tends to go for any dude who walks into her “gym”.
I guess you endorse the life style of Hershel Walker. Date anything in a skirt but make sure she gets an abortion so he does not have to pay for child support.
She has spent a lot of time running around the country with Matt Gaetz, but is probably too old for him.
So, for H1:
1. GDP was down
2. Inflation was up
3. Civilian employment was flat to down
4. Jobs were up
5. Productivity was down.
Put another way, we have a lot of people taking second jobs to pay the bills due to inflation. We have a massive stimulus rolling off. So those second jobs were low productivity jobs and were insufficient in aggregate to offset the contractionary effects of end of stimulus. That’s the basic read, no?
But you’d better be real careful projecting that onto 2023.
Steven Kopits: You do know civilian employment rose by 2.1 million from 2021M12 to 2022M06?
Real GDI was up and your statement about employment was either a sign you have gone insane or you have zero integrity. Of course they are not mutually exclusive in your case.
Here is why Stevie never past preK arithmetic. Yes real GDP fell very slightly. Now he may think employment declined but then he writes productivity (the ratio of real GDP to employment) fell?
Folks – never hire a consultant who failed preK arithmetic. Geesh!
“So those second jobs were low productivity jobs and were insufficient in aggregate to offset the contractionary effects of end of stimulus. That’s the basic read, no?”
Wait – the first half of that sentence has to do with supply while the second half has to do with aggregate demand. Only the most clueless wonder would put those together they way you do.
Come Stevie – your knowledge of even the basics of macroeconomics is nonexistent. So stop commenting and get you clueless brain down to the local community college to take Principles of Economics.
Mfg wages are just incredible. One has to wonder how much collective agreements and unions may have played a role, with union contracts locking in workers at wages assuming low inflation. If that’s the case, we’re going to see surging union wages in 2023. More inflation.
Let me get this straight. You are saying unions are working to reduce real wages? Like it is not possible to renegotiate a long-term contract?
You make a lot of really dumb comments but this one takes the cake.
Oh, for goodness sake, at least pretend to think before writing! In one comment, you bemoan weak productivity and in the next, you wring your hands over falling factory wages, then make an unsubstantiated scare-prediction without looking at factory productivity.
I’ve already done the work for you on factory wages in an earlier comment. There’s a good chance some of the fall is due to composition – lower-wage, lower-unionization-rate states adding factory jobs faster than others states. Meanwhile, factory productivity has held up pretty well in recent quarters and is improved since before the Covid recession; wage increases wouldn’t necessarily be inflationary.
https://fred.stlouisfed.org/graph/?g=VKWs
Took two minutes to pull up the data and make the chart. You couldn’t be bothered to find out that your story isn’t consistent with the data.
Stevie, you can’t expect consulting clients to admire this sort of oversimplification. Are you angling for a job with faux news?
Total Unit Labor Cost: Manufacturing for the United States
https://fred.stlouisfed.org/series/LCULMN01USQ661S
A measure that captures nominal wage growth and productivity changes. Of course one would have to inflation adjust this. Someone please inform Stevie of this advanced tool known as Excel.