The debate over whether the establishment survey is mismeasuring employment growth over the April-June 2022 period continues, with the Philadelphia Fed asserting the net job growth was only 10 thousand, vs. the roughly 1 million reported by BLS. The outcomes of their calculations are presented in the following figure:
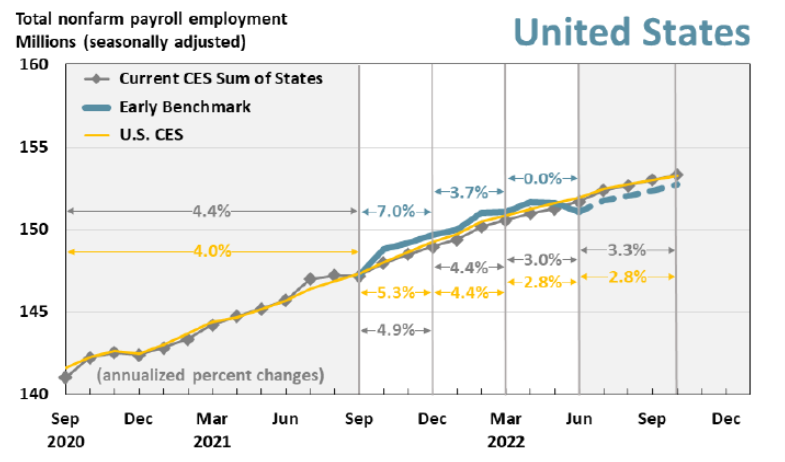
As I understand it, the analysts go down to the state level, adjust to match QCEW levels to NFP, seasonally adjust, and then aggregate up to national level using the state level data. I have no good feeling for how well their procedure works over time (explained here), but the approach seems plausible.
In contrast, I have compared the series at a high level of aggregation to see if the NFP series as reported by the CES is behaving in an anomalous way with respect to the QCEW. Since the latter is in not-seasonally adjusted terms, then one would want to compare against the NFP in not-seasonally adjusted terms. Shown below are comparisons in percent terms (gap at 2022M06 is 0.36 ppts, log terms), and in absolute (000’s) terms (gap is 581 thousand).
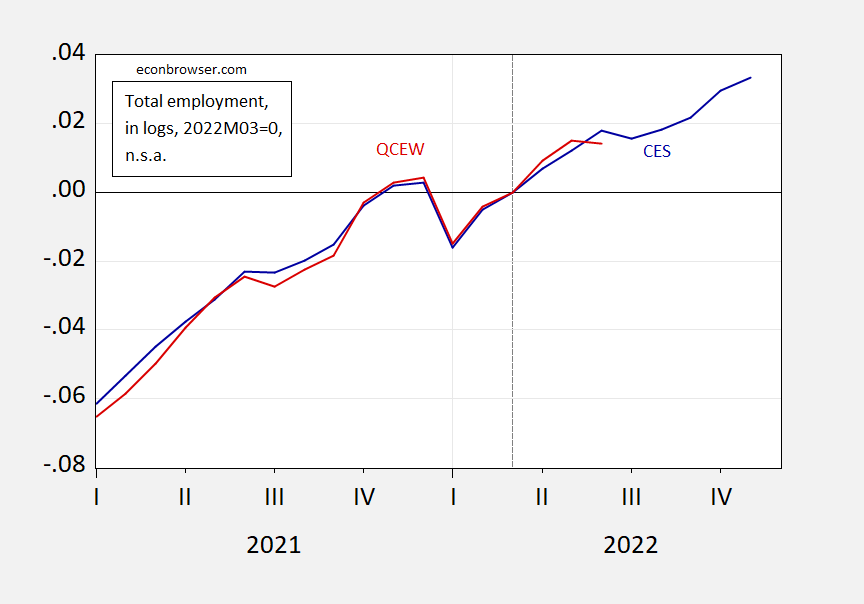
Figure 1: Nonfarm payroll employment (blue), and total covered employment in US (red), not seasonally adjusted, all in logs, 2022M03=0. Source: BLS, and athor’s calculations.
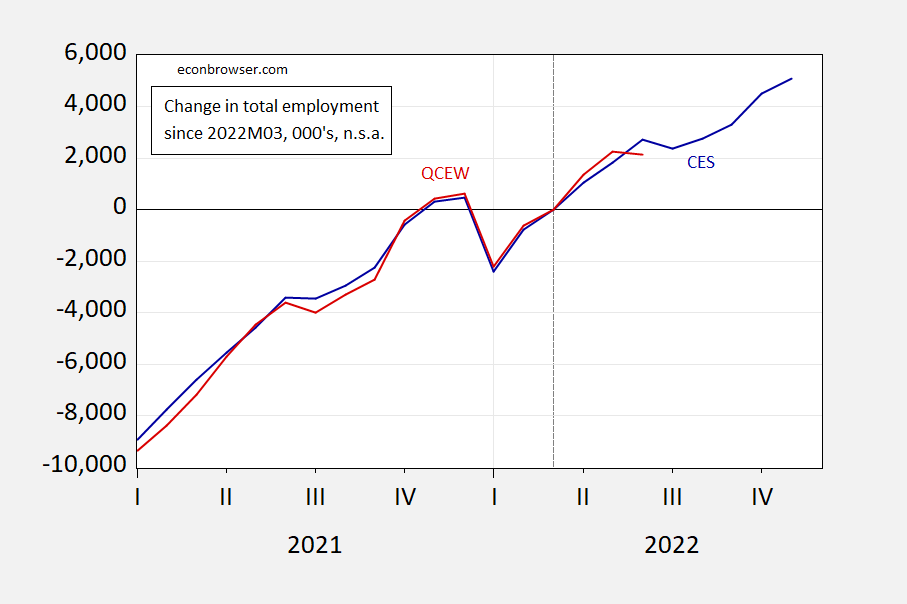
Figure 2: Nonfarm payroll employment (blue), and total covered employment in US (red), not seasonally adjusted, relative to 2022M03, in 000’s. Source: BLS, calculations.
If one thought that QCEW was more accurate, and nonfarm payroll inaccurate, then one would want to see if the relationship between them had changed. In point of fact, reported employment has been lower than average in the past year, and with the exception of 22M06.
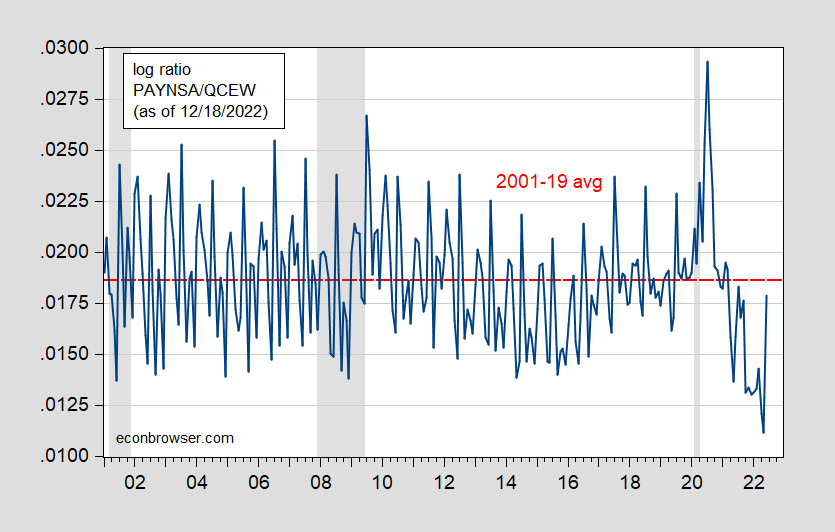
Figure 3: Log ratio of nsa NFP to QCEW (blue), and 2001-19 average (red dashed line). NBER defined peak-to-trough recession dates shaded gray. Source: BLS via FRED, BLS (as of 12/18/2022), NBER, and author’s calculations.
As I noted earlier, for private NFP, we have independent verification of trends through the ADP survey, which shows much higher job creation than the BLS series.
So the bottom line is that we have all sorts of data that the RECESSION CHEERLEADERS can use to misrepresent. Got it!
pgl v RECESSION CHEERLEADERS dueling interpretations!
Here’s a comparison of the QCEW with the Establishment survey, from the QCEW site:
https://www.bls.gov/cew/publications/employment-and-wages-annual-averages/current/home.htm#comparison
Source:
QCEW: Count of UI administrative records submitted by 11.3 million establishments in the first quarter of 2022
CES: Sample survey: 670,000 individual worksites in 2022
Coverage:
QCEW: Coverage for UI and Unemployment Compensation for Federal Employees (UCFE); coverage is required of all employers subject to state and federal UI laws
CES: Nonfarm wage and salary jobs: Jobs covered by UI; excluded are agricultural jobs, jobs in private households, and jobs held by self-employed workers. Jobs not covered by UI, including railroad jobs, jobs in religious organizations, and other non-UI-covered jobs
So the QCEW is much more comprehensive, but covers a slightly different population of workers than the CES.
Here is the late Jeff Miller, a portfolio manager who had previously been a professor teaching public policy and quantitative methodology at the University of Wisconsin-Madison and Lawrence University, on the QCEW:
https://seekingalpha.com/article/190299-employment-data-business-media-punditry-miss-key-story
“Each quarter the BLS reports data from state employment agencies. Since no one pays insurance premiums on phantom employees, we can expect conservative information. The only problem is that it takes about nine months to get these actual counts.
“Any honest observer of the market would circle the date of this release….”
As to the the unique divergence in trend for the first 6 months of 2022 between the two reports as shown in your last graph, my guess would be that the discrepancy is going to get revised away. I say that because the QCEW data for the first 6 months of 2022 is said to be preliminary:
https://data.bls.gov/timeseries/ENUUS00010010&output_view=pct_12mths
And we know there will be several benchmark revisions to the CES data as well.
Interestingly, the national YoY QCEW growth for Q1 and Q2 is roughly +5% and +4% respectively, which is pretty similar to the CES YoY change. So I’m not sure how the Philadelphia Fed report fits with that. I wish they gave us an explanation.
Finally, I went back and pulled my recapitulation of the YoY tax withholding data for the first 6 months of 2022:
$273.2 B for the month of January 2022 vs. $225.3 B in 2021, up +21.3%
$258.2 B for the month of February 2022 vs. $231.4 B in 2021, up +11.6%
$304.3 B for the month of March 2022 vs. $286.6 B in 2021, up +6.2%
$254.2 B for the month of April 2022 vs. $228.0 B in 2021, up +11.5%
$246.7 for the month of May 2022 vs. $211.2 B in 2021, up +17.2%
$242.3 B for the month of June 2022 vs. $241.2 B in 2021, up +0.5%
That totals $835.7 B for Q1 2022 vs. $743.3 B in 2021, an increase of +12.4%.
VS. $734.2 B in Q2 2022 vs. $680.4 B in 2021, an increase of +7.9%.
My rule of thumb for YoY data that can’t be seasonally adjusted is that a decline of 50% from the 12 month high is probably close to the turning point. So if Q2 had declined to +6.1% YoY, that would have signaled a peak. Still, the decline to +7.9% YoY is very substantial deceleration from Q1 to Q2. [Note: I think it should also be deflated by average hourly wages, but I’m a fan of K.I.S.S.]
In contrast, for the last 20 reporting days through last Wednesday, $247.6 B was paid this year vs. $242.8 B one year ago, up only +2.0%.
BTW, Prof. Chinn, I really do appreciate all the effort you are putting into this issue, assembling the data and posting it graphically.
ADP reports that we’re 0.56% above the peak reached before the pandemic. Fred reports that we’re down 0.25%.
https://fred.stlouisfed.org/series/CE16OV
https://adpemploymentreport.com/
Sounds like a difference trivial enough to be worthy of a good pissing match like we witnessed over H1 GDP growth. I’ll watch with relish.
It is your good buddy Princeton Steve that is doing all what you call “pissing”. Of course you have been misrepresenting UK real wage data during the 2010-2018 period for years and years. So have your mommy wash your lying mouth out with soap.
Johnny,
It’s no wonder you find that debate memorable. You wet your own trousers pretty regularly on this one. You argued at one point that GDPNow estimates for Q3 were following a pattern similar to the pattern for Q2, which you gleefully sugested would mean weak Q3 GDP growth.
I offered you a bet. You ducked the bet, andhave since changed your story. You went from recession cheerleader to pretending that the debate was trivial. In fact, the debate was political. You, who try so hard to mask your politics, now want to obscure your role in the debate. This litle pose of yours is transparent, just like your pretending to be a progressive friends of the middle class.
Allow me to point out again that this is an economics blog. Recession, employment and inflation, are the stuff of economcs. When commenters get economics wrong, our hosts have every reason to point out the error. Repetition of the error draws repeated correction. If this were a sports blog, and commenters claimed the final game of the World Cup was a draw because shootouts don’t count, we could expect those commenters to be corrected. The rules of the game are what they are.
Speaking of the World Cup – a few of the French fans have suggested Messi’s extra time goal should not count. Two claims:
(1) He was offsides – the replays however clearly show he was on-side at the critical moment.
(2) Argentina’s team illegally ran on the pitch before the goal shot was made – again the tapes clearly show they ran onto the field after Messi delivered the goal.
But hey – people make a lot of absurd claims on the internet. Case in point – our own JohnH!