From Popina, McCormick, and Beyoud, “Traders lose trust…” in Bloomberg today:
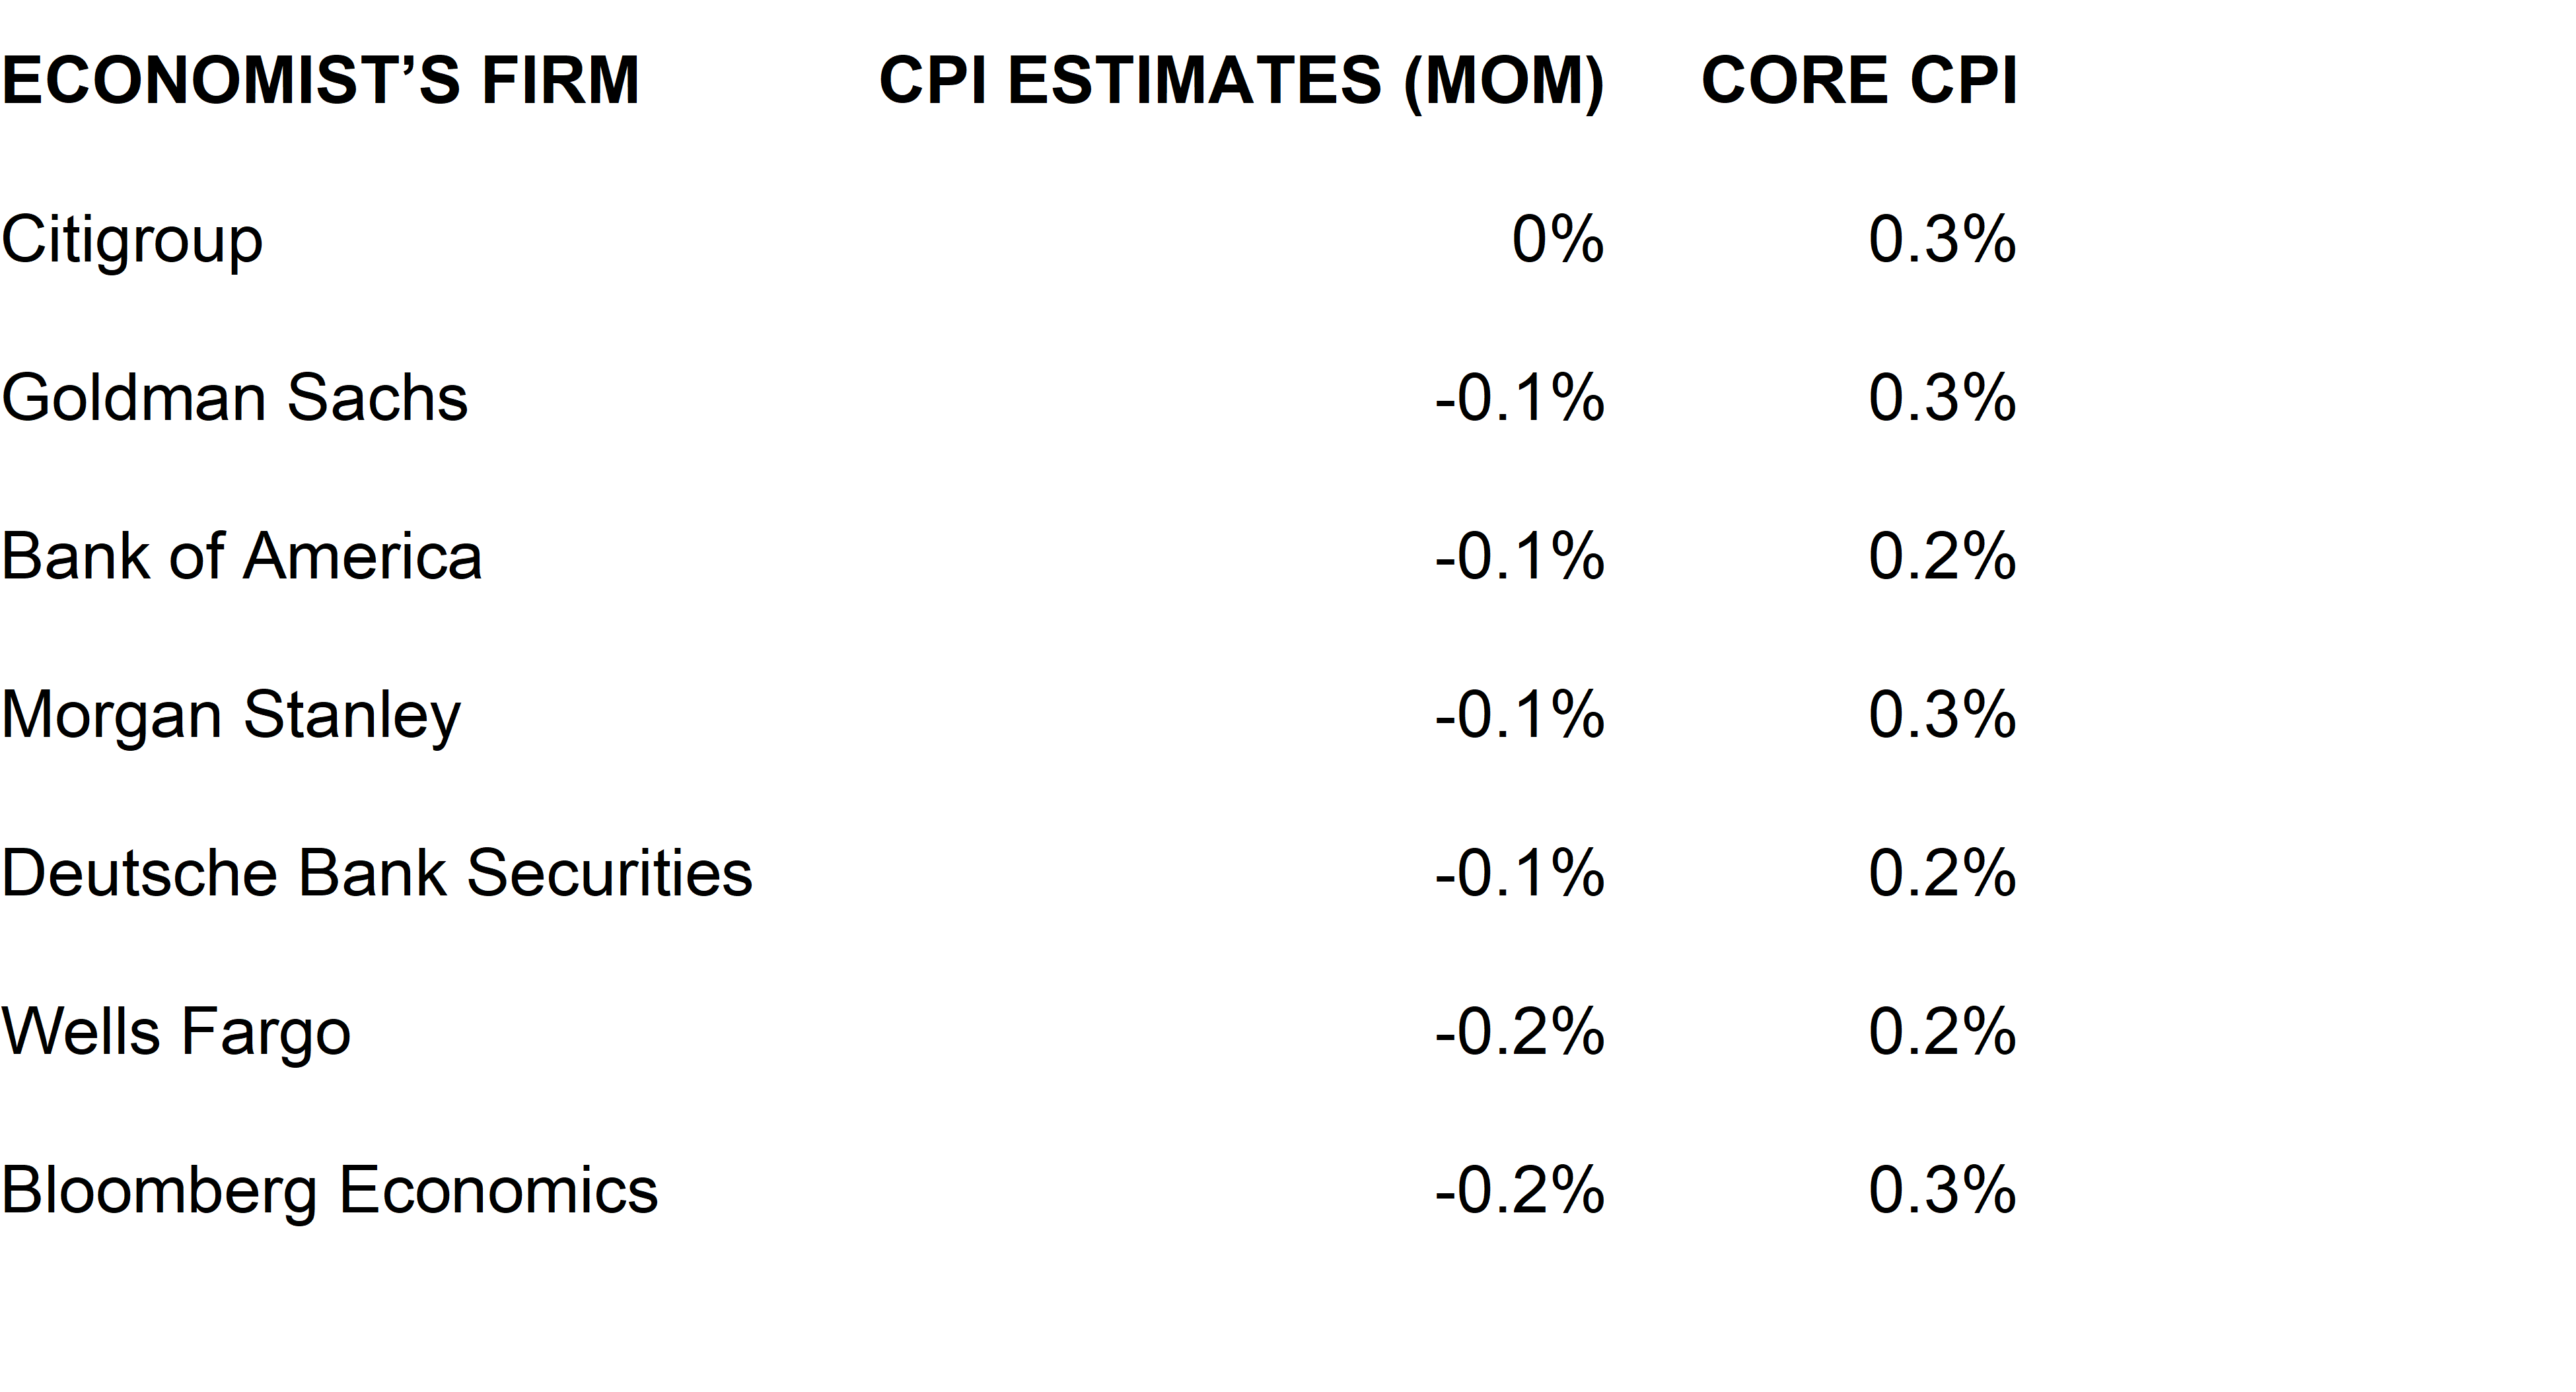
Source: Popina et al., Bloomberg, 11 January 2023.
I thought it of interest to compare against the Cleveland Fed’s nowcast. Here are the levels of headline and core CPI.
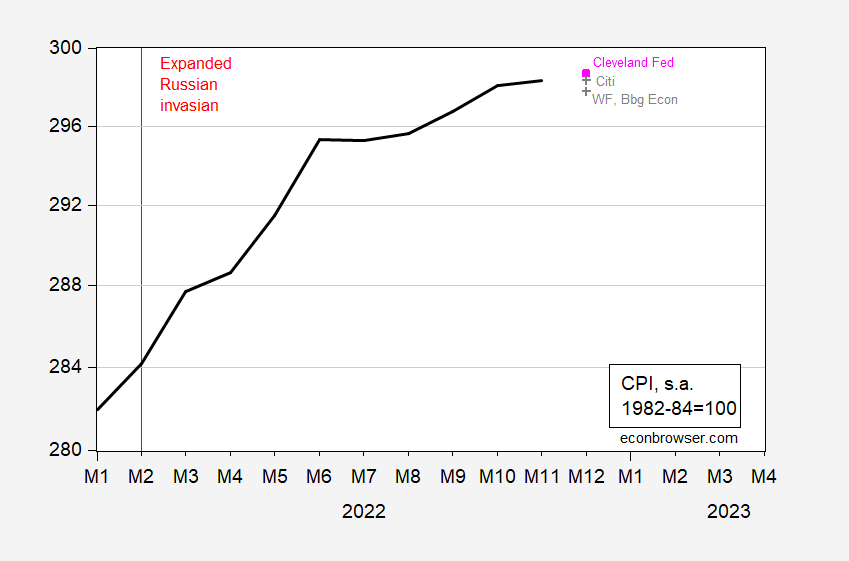
Figure 1: CPI level, 1982-84=100 (black), Cleveland Fed nowcast as of 1/11/2023 (pink square), high and low forecasts (gray +). Source: BLS via FRED, Cleveland Fed, Bloomberg (1/11/23), author’s calculations.
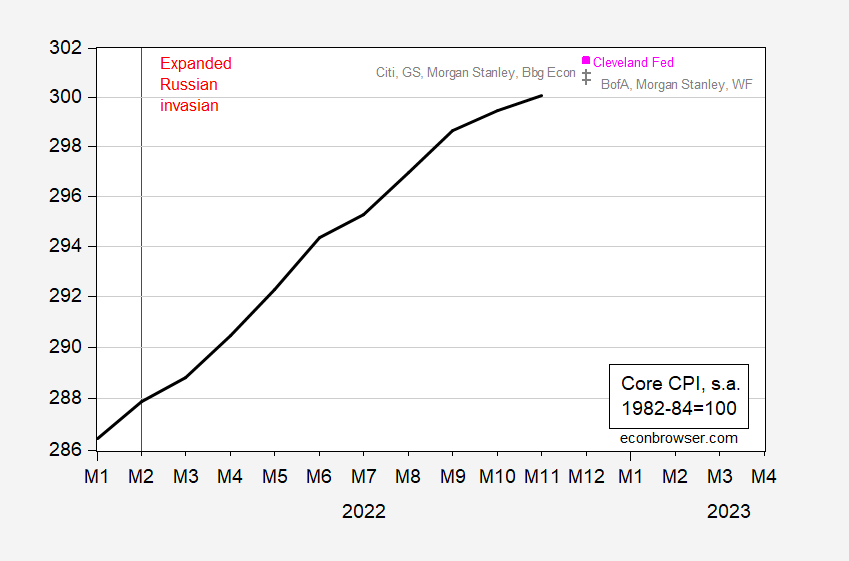
Figure 2: Core CPI level, 1982-84=100 (black), Cleveland Fed nowcast as of 1/11/2023 (pink square), high and low forecasts (gray +). Source: BLS via FRED, Cleveland Fed, Bloomberg (1/11/23), author’s calculations.
What does this mean for core inflation? In Figure 3 I plot the actual and implied inflation rates.
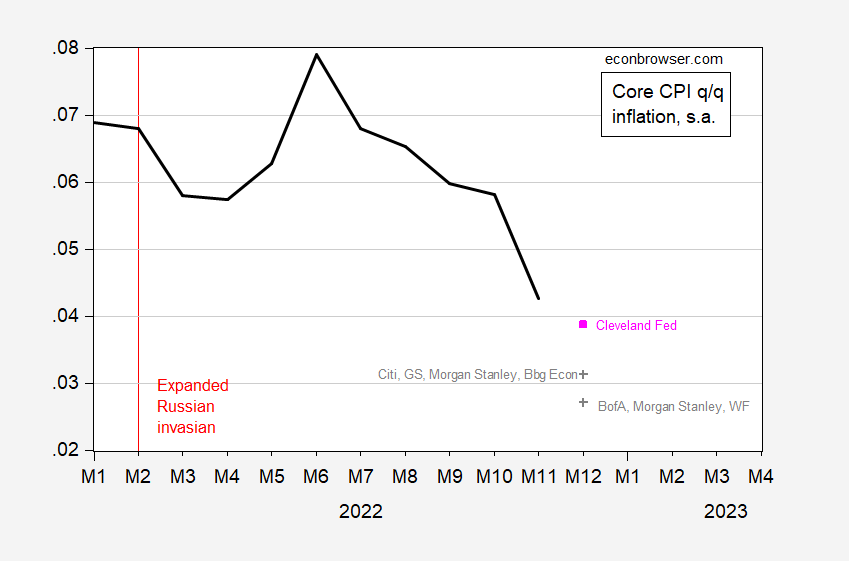
Figure 3: Quarter-on-quarter core CPI inflation rate, annualized (black), Cleveland Fed nowcast as of 1/11/2023 (pink square), high and low forecasts (gray +). Source: BLS via FRED, Cleveland Fed, Bloomberg (1/11/23), author’s calculations.
Even with the high estimate of the Cleveland Fed’s nowcast, core inflation is decreasing on a q/q basis.
Briefing.com is forecasting CPI All at 0.1% for the month.
and CPI Core at 0.4% for the month. Briefing.com is the only forecasting source that I have seen forecasting CPI Core at 0.4% increase for the month.
Core CPI inflation has two main components, commodity inflation excluding energy and services inflation excluding inflation. Each has a different pattern of inflation.
Core commodities inflation (excludes energy) looks like it could show a -0.09% decrease for the month.
Core services inflation (excludes energy) looks like it could show a 0.55% increase for the month.
Using a weight of 0.258 for commodities and 0.742 for services, core CPI could
show (as Briefing.com forecasts) a monthly increase of 0.4%, (0.258*-0.09 + 0.742*0.55).
I used Excel Solver to find the optimum allocation weights for the period 2019m01 to 2022m11, so it will be interesting to see how far off I am from the experts.
Meant to say, “excludes food and energy”.
Cleveland Fed core price measure forecasts rely entirely on past months’ core inflation. Same with the food price component of headline inflation. The only data for the month for which the nowcast is made are gasoline and crude oil prices.
That sounds a little thin, but the website claims “…the Cleveland Fed’s model nowcasts have done quite well—in many cases, they have been more accurate than common benchmarks from alternative statistical models and even consensus inflation nowcasts from surveys of professional forecasters.” It’s not clear what “in many cases” means here. There have been lengthy stretches of time when median forecasts have been right month after month. That has not been the case lately, but during those periods, it is hard to be more accurate than the median forecast. I’m interested to know how well the Cleveland nowcast has done recently, when forecasting has been difficult.
Off topic, Cryptogrifters –
As I have said in the past, I don’t give a rodent’s furry backside about the crypto-currency unless it threatens to cause systemic problems. Well, Silvergate Bank is not a SIFI, so may e this doesn’t count:
https://www.americanbanker.com/news/silvergate-bank-loaded-up-on-4-3-billion-in-fhlb-advances
Silvergate, which was once mostly a mortgage lender and still has access to Federal Home Loan Bank backing, now brags about being a crypto-currency and electronic asset lender. When FTX became a bug on the Fed’s windshield, Silvergate nearly did, too. It took 4.3 billion in bailout money to keep Silvergate afloat.
Note that FHLB is ahead of the FDIC in liquidation, so the FDIC is on the hook for FHLB’s $4.3 billion. Not ideal.
https://www.bls.gov/news.release/cpi.nr0.htm
CONSUMER PRICE INDEX – DECEMBER 2022
The Consumer Price Index for All Urban Consumers (CPI-U) declined 0.1 percent in December on a seasonally adjusted basis, after increasing 0.1 percent in November, the U.S. Bureau of Labor Statistics reported today. Over the last 12 months, the all items index increased 6.5 percent before
seasonal adjustment.
The index for gasoline was by far the largest contributor to the monthly all items decrease, more than offsetting increases in shelter indexes. The food index increased 0.3 percent over the month with the food at home index rising 0.2 percent. The energy index decreased 4.5 percent over the month as the gasoline index declined; other major energy component indexes increased over the month.
The index for all items less food and energy rose 0.3 percent in December, after rising 0.2 percent in November. Indexes which increased in December include the shelter, household furnishings and operations, motor vehicle insurance, recreation, and apparel indexes. The indexes for used cars and trucks, and airline fares were among those that decreased over the month.
Wait, wait – CPI in Dec. was the same as it was in Oct. Which means over the past 2 months inflation has averaged zero. Now we were told by Nobel Prize winning economist Dr. Bruce Hall that inflation was 13.3% as energy prices were still rising. Wait, wait – Brucie has a fake resume so maybe we should pay more attention to Dr. Alan Blinder (never mind Brucie had no clue what Dr. Blinder recently wrote).
I was going to point out to Dr. Bruce Hall that he needs to distinguish between the price LEVEL (CPI) and its first derivative (rate of change of the price level or inflation) but the last time I used this language amateur attorney Rick Stryker went off on some esoteric side show. Then again FRED provides the following graph of CPI.
https://fred.stlouisfed.org/series/CPIAUCSL
Since Dr. Bruce Hall was lost when he read the excellent recent discussion ala Dr. Alan Blinder, I thought this graph would clarify matters for poor little Brucie boy. Notice after the economy got over our pandemic related lockdown in the last few months of the Trump disaster, the slope of this line was quite steep for a couple of years. But the slope of this line is relatively flat. So unless one is Mr. Magoo, it is quite easy to discern what Dr. Blinder wrote – inflation has been quite low for the past several months.
Oh wait Kelly Anne Conway told Brucie Boy that inflation was 13.3% so I guess FRED is lying to us. MAGA!