[Updated to include December data] Late to the commentary, here’s a picture of the jobs-workers gap for November, based on JOLTS data:
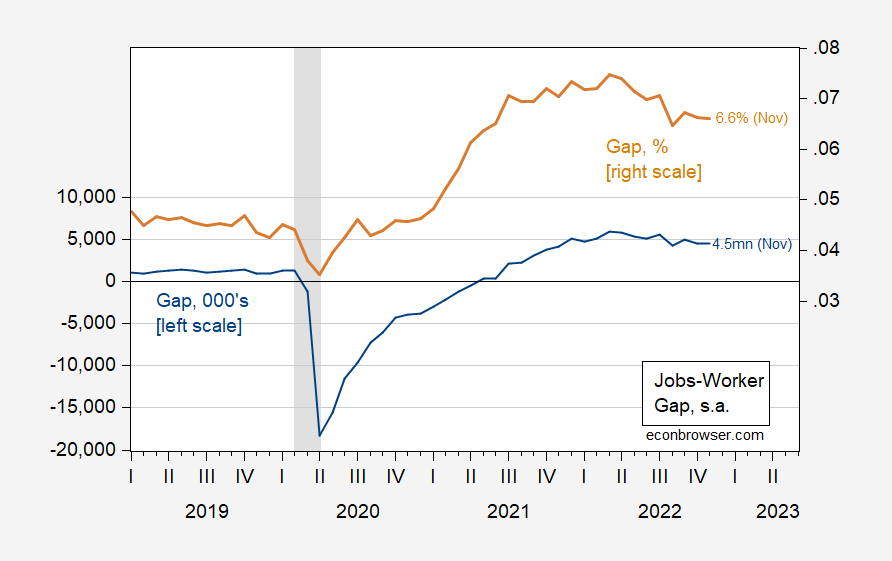
Figure 1: Jobs-worker gap, 000’s, s.a. (blue, left scale), and gap, %, s.a. (tan, right scale). NBER defined peak-to-trough recession dates shaded gray. Source: BLS JOLTS data via FRED, NBER, and author’s calculations.
Note that the gap remains large, so the labor market remains tight (and in fact the gap was at a maximum in 2022H1). To see this further, layoff rates are still far from hiring rates.

Figure 2: Hirings to nonfarm payroll employment (blue), and hiring to nonfarm payroll employment. (tan). NBER defined peak-to-trough recession dates shaded gray. Source: BLS JOLTS data via FRED, and author’s calculations.
The quit rate actually rose in November. From my view, the labor market remains pretty tight, and I observed that on Marketplace on Monday.
Are we in recession as of November? We can use the Job Workers Gap Business Cycle Indicator (JWGBCI) suggested by Paweł Skrzypczyński in this post, which equals the difference between the current gap and the maximum gap over the last 12 months. The value for 2022M11 is -0.89, still above the threshold value of -0.93 — but it is coming closeer over time (it actually breached the threshold, as I have calculated it, in August before popping above the threshold).
Updated and corrected, 1/6/23 10:45PM:
My calculation of the JWGBCI was failed to use the 3 month smoothed series in the calculation. Pawel Skryzypczinski provided the correct calculation and graph:
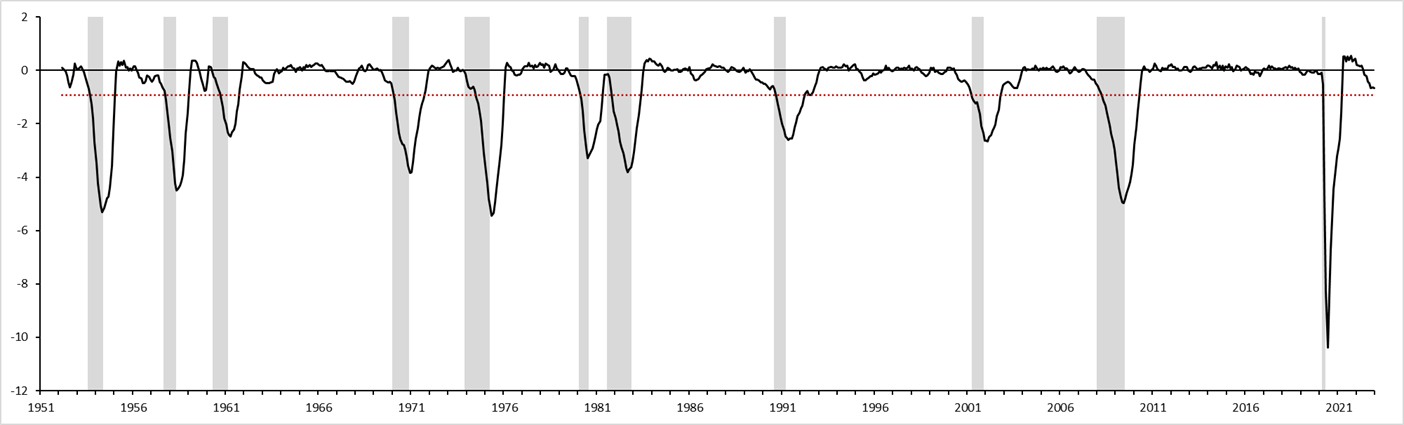
Dr. Skrzyzpczinski observes: “As of December 2022 the jobs-workers gap was at 2.9% or 4.7 mn, up from November by 0.2 pp or 0.2 mn (job openings assumed to be unchanged in December form November). Revisions to HH survey had minor impact on the measure. This new data brings the JWGBCI to -0.7 pp down from -0.6 pp in November and still above the recession threshold of -0.93 pp. To make a recession call for January 2023 we would need to see the jobs-workers gap to collapse to 1.9% from 2.9% in December, very unlikely.”
“Note that the gap remains large, so the labor market remains tight (and in fact the gap was at a maximum in 2022H1).”
Another labor market issue that Princeton Steve kept misrepresenting.
WSJ, December 19, 2021: “Sky-High Lumber Prices Are Back. Pricing service Random Lengths said that its framing composite index, which tracks on-the-spot sales, has jumped 65% since October, to $915. A $129 gain this week was the biggest on record, eclipsing a $124 jump in May, when lumber prices crested at all-time highs.”
https://www.wsj.com/articles/sky-high-lumber-prices-are-back-11639842879
My, my my! How could the WSJ have been so wrong? I mean, doesn’t everyone know that lumber prices declined during Fall of 2021?
Even more interesting is that the climb was 65%, exactly the number forecast by an industry insider that I linked to in August 2021. (Some people here expressed skepticism about that prediction at the time!)
More interesting yet is that the WSJ made no mention of Russia being responsible for the rising prices in Fall, 2021. How could the WSJ and all their industry sources possibly have missed such an important driver? My guess is that MacroDucky must have thought that Putin made Biden enact those November, 2021 tariffs on Canadian lumber, a major price driver that had been a major risk, well known months before. MacroDucky must also have blamed Putin for adverse weather in British Columbia, even though he is also convinced that a man with such godly power is absolutely, positively losing in Ukraine…go figure!!!
I rest my case.
“I rest my case.”
Indeed. Hamilton Burger would be proud of you.
(I hope this dig at a fictional male character’s professional competence is not interpreted as misandry. I’m doing my best to control myself, damn it)
I know Miss Andry. Miss Andry is a friend of mine. You, sir, are no Miss Andry.
I’m trying.
This is my weak attempt at a protest of Menzie’s over-reaction to my criticism of this woman or that woman here on the blog. He’s apparently somewhat led around by the nose by Barkley, who can’t make an argument on the argument’s own grounds, so Barkley’s now made up my personal bio, gender biases, and psychological profile all with his own sad version of imagination with childish hints about “conversations” he’s had with Menzie about me. He doesn’t realize how humorous I find the mental visualization of two PhDs wasting their time discussing a guy they don’t know with a simple Bachelor’s from a small state university.
I’ve insulted men on this blog at probably a 20-to-1 ratio to my criticism of individual women, but because Barkley can’t argue facts, my criticisms of any female on the blog (which probably rank 1/3rd of the harshness of things pgl has said) are now so out of taste. They both insist that “ltr” who has given zero hints of being female, and who they both openly detest “MUST” be female ” ‘cuz…. ‘cuz….. well…… ‘cuz” What might that point out to even a pea sized brain their own true feelings related to gender??
The reality is, I shouldn’t let it bother me. Only I can smell a fraud from 500+ miles away, and the smell from Harrisonburg of a man waaaaay too in love with some self-righteous concept of himself to have any idea what it means to be tolerant on gender (other than “keeping up with appearances”, and not very good at that) is too much for me.
Moses,
Yes, you really should not let bother you.
“1/3rd of the harshness of things pgl has said”
I am an equal opportunity critique of BS after all. Whether the troll is male or female, their BS is going to be called out regardless. Although I do use the word “boy” a lot.
admirable
“I rest my case.”
What case – you got everything wrong about the economics of the lumber sector. EVERYTHING!
So you rest your case that you may or may not have got a date right. Hey dumbass – go back and read your link to Paul Franke about duopolies – dated in 2020 before the rise in lumber prices. That is your explanation for an even the next year?
Lord – you have proven one thing. You are the dumbest troll God ever invented.
‘MacroDucky must also have blamed Putin for adverse weather in British Columbia’
Weather? That is why timber prices fell? WTF?
I did link to someone in British Columbia who knows a lot more about the lumber sector than Jonny boy ever could. He noted the consolidation in the sawmill sector which I noted. He did not make the unproven and idiotic claim that it was all rising profit margins for Home Depot. BTW Jonny boy I already pointed out that the gross margin for Home Depot FELL from the time your Franke dude wrote his piece in early 2020 to 2021 when lumber prices at the WHOLESALE level rose.
Again – you got EVERTYTHING about this issue completely wrong. Take a bow troll!
“Sky-High Lumber Prices Are Back
Builders are buying up wood while floods in British Columbia limit supply”
I just listened to the 2 minute discussion which was clearly talking about WHOLESALE prices – which is the cost of goods sold for Home Depot not its revenue. Jonny boy flunks basic accounting. OK – maybe those floods reduced the supply of timber but wait timber prices fell. Wait, wait – the margins for the sawmills may have what drove up lumber prices – a point every smart person gets. But Jonny boy is not a smart person so he blames Home Depot for having to incur higher costs which Jonny boy thinks led to more not less profits. Yea – Jonny boy is THAT STUPID. K
” My guess is that MacroDucky must have thought that Putin made Biden enact those November, 2021 tariffs on Canadian lumber, a major price driver that had been a major risk, well known months before.”
A tariff on Canadian TIMBER may increase its price to US sawmills (come on Jonny – please get the difference between timber and lumber as it is rather fundamental). But wait – timber prices fell. Jonny, Jonny, Jonny. Get this straight – the series you cite are WHOLESALE prices for lumber – not the RETAIL price. And the price of timber is not the price of lumber.
Now until you get the basics, maybe you should shut up as you have embarrassed your mother enough already.
Johnny, I am honored! You’ve attacked my position, which means there is an 93% probability that I’m right.
You keep resorting to finding some guy who wrote something which may tangentially support your position, as if that’s the pinnacle of evidence. So, for those who haven’t followed this debate, Johnny recently insisted that:
“In the Fall of 2021 nobody was talking about a Russian attack on Ukraine.”
Evidence that Russia’s invasion was expected then presented. Johnny hasn’t refuted that evidence because he can’t; Johnny was wrong, as he is 97% of the time, Johnny has instead changed the subject. He wants to ignore his earlier mistaken claim and then “rest his case” even though he hasn’t made a case. All he has done is find one article about lumber which doesn’t mention the building expectation of a Russian invasion of Ukraine. Poor, poor Johnny. He needs so badly to feel good about himself, but keeps embarrassing himself in the effort.
Johnny, you can’t learn from you mistakes is you keep pretending you haven’t made them. It is simply not true that “In the Fall of 2021 nobody was talking about a Russian attack on Ukraine.”
“there is an 93% probability that I’m right.”
Only 93%? Jonny is at 100% – 100% of what he claims is wrong.
https://www.worldometers.info/coronavirus/
January 5, 2023
a ) There were 5,226 coronavirus deaths in China on May 26, 2022.
b ) There were no coronavirus deaths from May 26, for nearly 6 months, through November 19.
c ) From November 20 through January 4, 2023 there have been 32 coronavirus deaths in China, bringing the total from 5,226 to 5,258.
d ) During the nearly 6 months of no coronavirus deaths in China, there were 300 to 500 coronavirus deaths each day in the United States.
e ) Coronavirus deaths in the United States continue at 200 to 400 each day.
f ) There have been 1,120,040 coronavirus deaths in the United States through January 4, 2023.
https://www.worldometers.info/coronavirus/
January 4, 2023
Coronavirus
United States
Deaths ( 1,120,040)
Deaths per million ( 3,345)
China
Deaths ( 5,258)
Deaths per million ( 3.6)
https://www.worldometers.info/coronavirus/
January 4, 2023
Coronavirus
New York
Deaths ( 75,463)
Deaths per million ( 3,879)
China
Deaths ( 5,258)
Deaths per million ( 3.6)
Update on the Russian Oil Price Cap
https://www.princetonpolicy.com/ppa-blog/2023/1/5/russia-refined-products-and-the-oil-price-cap
Contrary to the hopes of Price Cap proponents followed by noting barrels exported and revenues are down?
Come on Stevie – no one wants to read a blog post from someone who never learned to write. Or properly think either. Stop promoting your worthless blog here as this is an economist blog. Damn!
https://fred.stlouisfed.org/graph/?g=RTqx
August 4, 2014
Real per capita Gross Domestic Product for Mexico as a percent of Real per capita Gross Domestic Product for United States & Exports of Goods and Services by Mexico as a percent of Gross Domestic Product, 1992-2021
(Indexed to 1992)
https://fred.stlouisfed.org/graph/?g=RTqH
August 4, 2014
Real per capita Gross Domestic Product for Mexico as a percent of Real per capita Gross Domestic Product for United States & Exports of Goods and Services by Mexico as a percent of Gross Domestic Product, 1992-2021
(Indexed to 1992)
About Mexico, which was asked about, the years since the negotiation of and agreement to NAFTA have been economically difficult for the country. While NAFTA significantly increased Mexican exports, Mexican per capita growth has unfortunately lagged both the United States and countries through the Americas other than Argentina and Venezuela:
Since 1992 Mexican exports have grown by 583%, while per capita GDP set equal to the US in 1992 is now only 76.6% that of the US.
It is interesting that the latest from BLS had payroll survey employment rising by 223 thousand while the household survey indicated an increase = 717 thousand.