Weekly indicators from Lewis-Mertens-Stock (NY Fed) Weekly Economic Indicators, and Baumeister, Leiva-Leon and Sims WECI and Woloszko (OECD) Weekly Tracker through 1/14/2023, released yesterday.
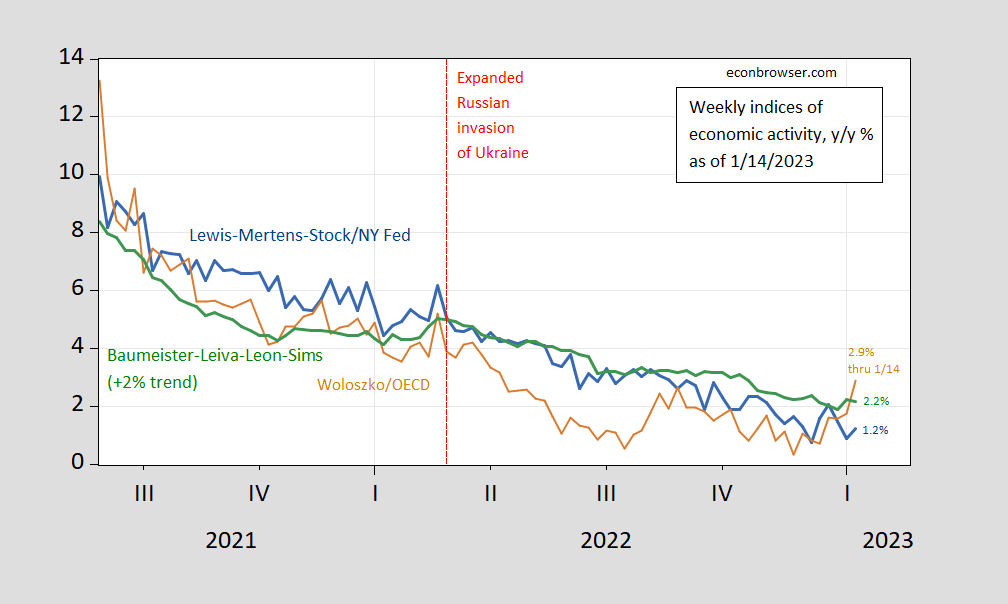
Figure 1: Lewis-Mertens-Stock Weekly Economic Index (blue), OECD Weekly Tracker (tan), Baumeister-Leiva-Leon-Sims Weekly Economic Conditions Index for US plus 2% trend (green). Source: NY Fed via FRED, OECD, WECI, and author’s calculations.
There’s been a sharp rebound in the Weekly Tracker, which had dipped into negative for the week ending 11/26, now exceeding the WEI (1.2%) and WECI+2% (2.2%). The WEI reading for the week ending 1/14 of 1.2% is interpretable as a y/y quarter growth of 1.2% if the 1.2% reading were to persist for an entire quarter.The Baumeister et al. reading of 0.17% is interpreted as a 0.17% growth rate in excess of long term trend growth rate. Average growth of US GDP over the 2000-19 period is about 2%, so this implies a 2.17% growth rate for the year ending 12/24. The OECD Weekly Tracker reading of 2.9% is interpretable as a y/y growth rate of 2.9% for year ending 1/14. The 95% interval for the US weekly tracker is [2.3%, 4.2%].
The Baumeister, Leiva-Leon, Sims Weekly Economic Conditions Index is calculated at the state level. This allows one to see the dispersion in the cyclical component, shown in Figure 2 below (NOTE: these are cyclical rates, so add the state specific trend growth to get actual growth). The US series is shown as bold dark red, extending to 1/14/2023 (state level end two weeks earlier).
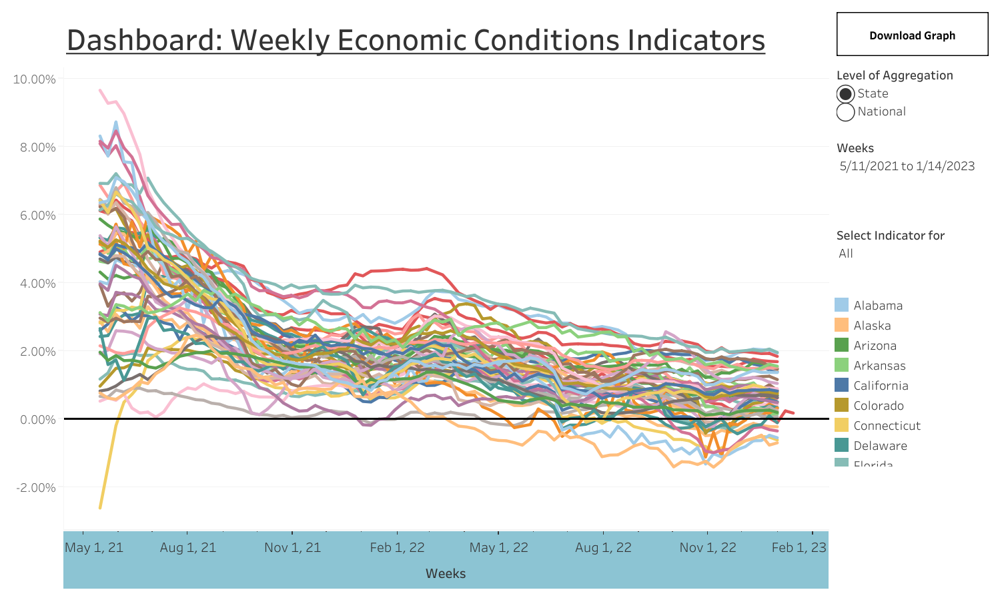
Figure 2: Baumeister-Leiva-Leon-Sims Weekly Economic Conditions Index for states (thru 12/31/2022) and US (thru 1/14/2023) (bold dark red). Source: WECI.
In sum, weekly indices are decelerating, with the exception of the Weekly Tracker which experiences substantial revisions. The WECI also shows decelerations in cyclical growth across most states.