(If you’re wondering about estimating seasonals — and you might be right wonder — then here’s the alternative.) QCEW data are not reported on a seasonally adjusted basis, which makes comparison with the other regularly reported BLS series, based on surveys, difficult. One way to address this issue, while sacrificing a more current perspective, is to use 12 month changes. Here is the QCEW series compared against two others measures of nonfarm payroll growth.
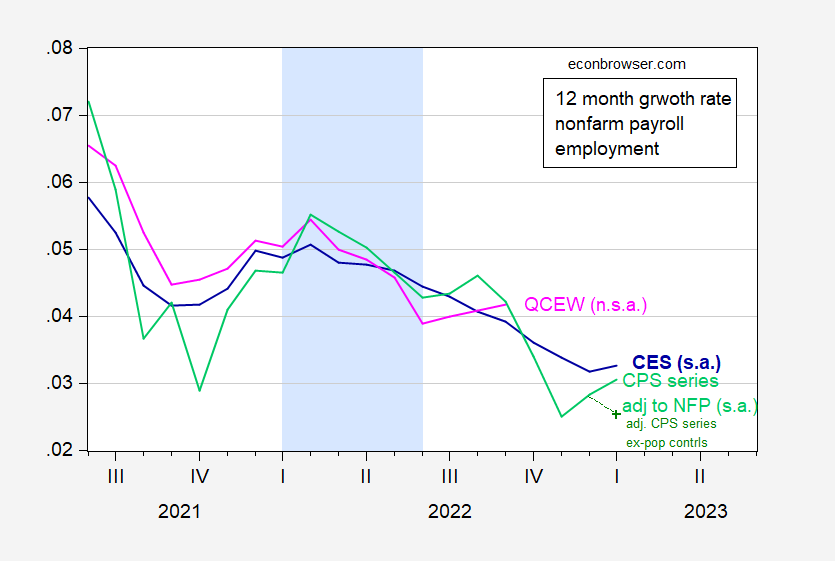
Figure 1: 12 month log difference in nonfarm payroll employment from January 2023 CES release incorporating benchmark revisions, s.a. (blue), household series adjusted to NFP concept (light green), household series adjusted, excluding population controls for January, s.a. (green +), QCEW total covered workers, n.s.a. (pink). Light blue shading denotes a hypothesized 2022H1 recession. Source: BLS via FRED, BLS, BLS QCEW, and author’s calculations.
Through September 2022, the 12 month growth rate in the CES NFP is 3.9% (using seasonally adjusted, or using seasonally unadjusted), while that for the QCEW is 4.2%. In numbers, the comparison is 5.9 million vs 6.2 million (CES vs QCEW).
See also this post.
In sum:
- QCEW is currently registering a larger 12 month change in percentage terms and numbers.
- No series registers a negative entry during the putative 2022H1 recession argued by some.
Addendum:
There’s a question whether these same results hold using private nonfarm payroll employment. We don’t have a CPS series adjusted to private NFP concept, but we do have an ADP series. I reprise Figure 1, with NFP counterparts, in Figure 2.
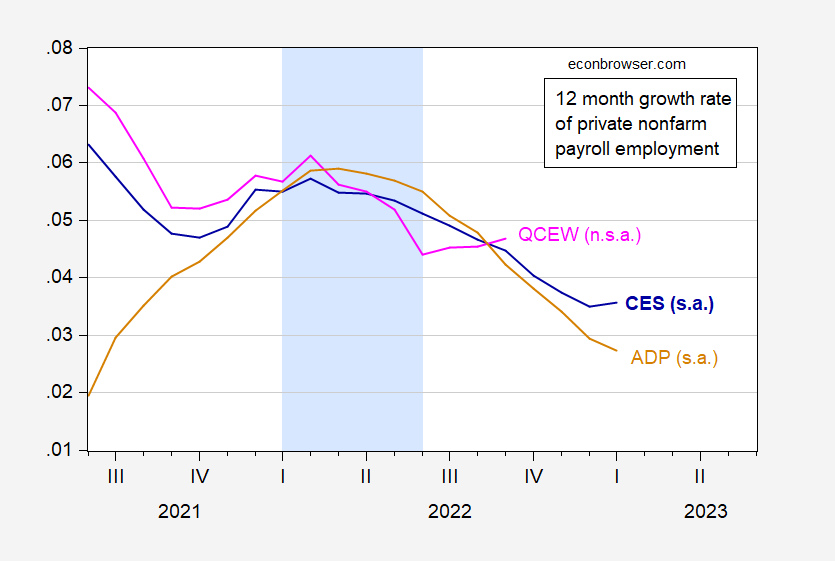
Figure 2: 12 month log difference in private nonfarm payroll employment from January 2023 CES release incorporating benchmark revisions, s.a. (blue), ADP private NFP (tan), QCEW private covered workers, n.s.a. (pink). Light blue shading denotes a hypothesized 2022H1 recession. Source: BLS and ADP via FRED, BLS QCEW, and author’s calculations.
Through September 2022, the 12 month growth rate in the CES private NFP is 4.5% (using seasonally adjusted), while that for the QCEW is 4.7%. In numbers, the comparison is 5.7 million vs 5.9 million (CES vs QCEW).
In sum, for private NFP counterparts to CPS and QCEW NFP series.
- QCEW is currently registering a larger 12 month change in percentage terms and numbers.
- No series registers a negative entry during the putative 2022H1 recession argued by some.
Ok Prof. Chinn, I am going to quibble. It appears you are using Payems, I.e., all jobs including government jobs.
Since as I understand it, the QCEW only includes private payrolls, you should use the series for all private employment. As of September 2022, that YoY change was 4.6%. And as I wrote, in *every* month since September 2021, the YoY change in QCEW was less than that of private payrolls.
Sorry to be contrary about it.
New Deal Democrat: I’m using BLS series ENUUS00010010 “All Employees in Total Covered Total, all industries for All establishment sizes in U.S. TOTAL, NSA”. You are referring to BLS series ENUUS00010510 “All Employees in Private Total, all industries for All establishment sizes in U.S. TOTAL, NSA”
Ok thanks. I am going back and re-reading all the source information in the QCEW.
Terrific and very edifying post.
I’m afraid you’re putting inordinate amounts of barbell weights on the barely above average muscle I call my brain—grasping the different characteristics, positives/negatives of the above employment barometers. Still…… I may be able to glean something here. Cross your fingers for the challenged (and lazy) among us. I need it.