World of Government Bonds has this interesting page which notes all the inverted yield curves. Shown below are those for S&P ratings of A to AAA as of today.
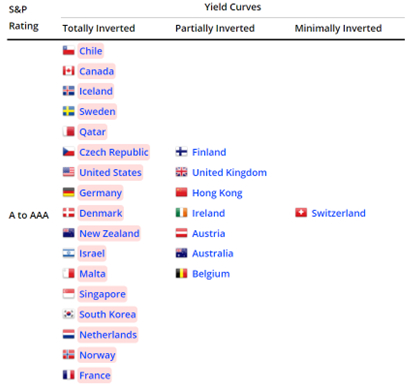
Source: World of Government Bonds, accessed 3/14/2023.
What does this mean? In Chinn and Kucko (2015), we examined the relationship between the ten year-three month term spread and recessions, as defined by ECRI (by NBER for the US). Using interest rate data up to 2021M12, here are the results for predicting recessions one year ahead. We noted that not all countries exhibited a reliable relationship between the 10yr-3mo spread and recession a year subsequent. Here are some preliminary results from work conducted with Laurent Ferrara, updating the data to 2021M12 (for interest rates), assuming no recessions have started in these countries as of December 2022.

Table 1: Probit regression results of recession dates one year ahead on term spread and 3 month interest rate (in decimal form). Bold denotes significance at 5% level. Source: Author’s calculations based on OECD interest rate data, ECRI recession dates (except for US, which uses NBER dates).
While there are a good number of significant entries for the term spread across countries, the sign is wrong for Italy. Even when the coefficient is significant, the pseudo-R2 is low (UK, and to a lesser extent, France). That means that the term spread really only seems useful for Canada, Germany and the US.
Here’re the simple predictions for Canada (not including the 3 month interest rate) and for Germany. Note however the last observation is the predicted probability for December 2023; probabilities for March 2023 (now) are quite low in both cases. (However, false negatives are quite common unless quite commond for Canada unless a low threshold is used.)
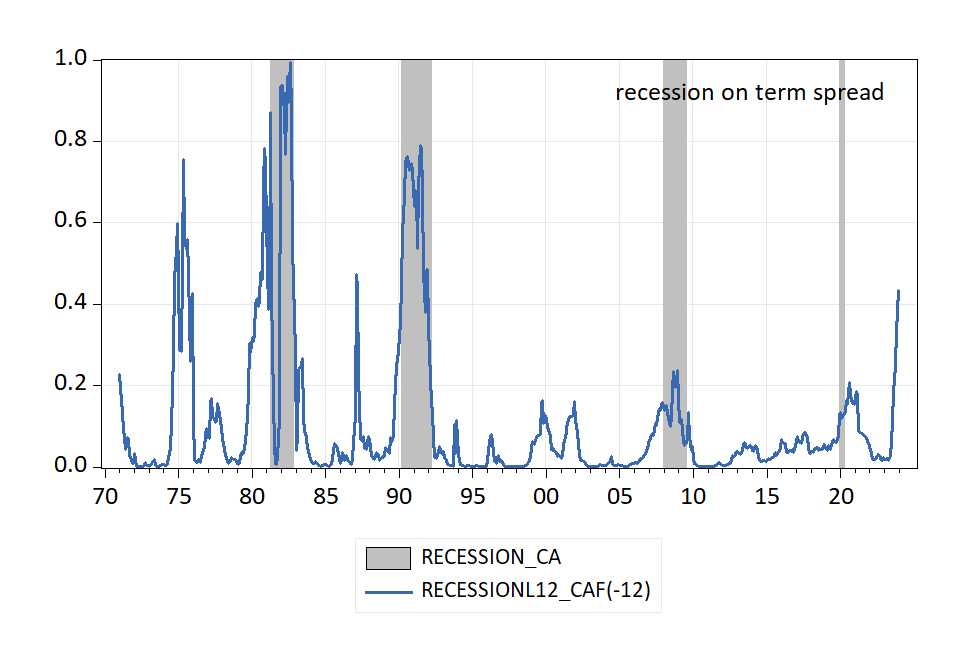
Figure 1: Probability of recession in given month from probit recession on Canadian 10yr-3mo term spread. Canada ECRI peak-to-trough recessions dates shaded gray. Source: OECD via FRED, ECRI and author’s calculations.
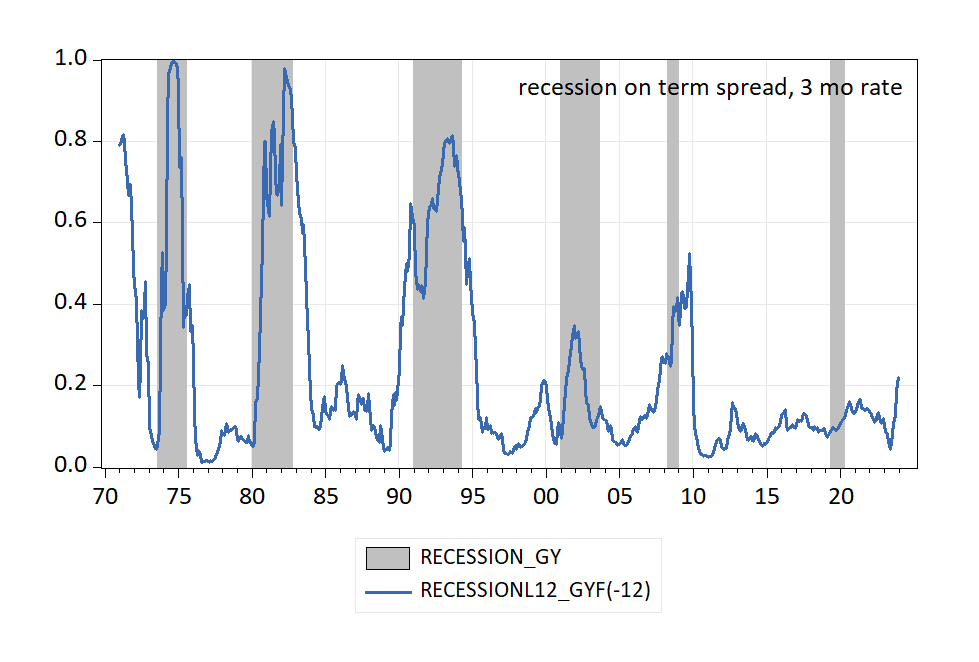
Figure 2: Probability of recession in given month from probit recession on German 10yr-3mo term spread. Germany ECRI peak-to-trough recessions dates shaded gray. Source: OECD via FRED, ECRI and author’s calculations.
This is true for the US as well, where the estimated probability of recession exceeds 50% only in December of 2023/January 2024. On the other hand, the 10yr-3mo spread put highest likelihood for the 2020M02-04 recession at 2020M08.
I am curious what it is about Germany and the U.S. that set them apart in this way. I suspect Canada’s economic and financial links to the U.S. account for Canada’s inclusion.
The U.S. has its own monetary policy. Germany (in theory) does not. The U.S. has no hard deficit limit. Germany has one. Labor laws are different. Germany’s trade/GDP ratio is 89% vs 24% for the U.S. In many of these regards, the U.S. is more like the UK than Germany. Just a spurious commonality?
The explanation usually offered for the predictive power of the yield curve is based on expectations of future short-term rates. The behavior of expectations should be similar for advanced economies, but apparently isn’t.
This is along the same lines of thinking I had. What is the factor (main one?? multiple??) that makes inverted yield curve a great wind vane in some countries and a bad wind vane in others?? It’s one of those deals, ask 1 question, and 5 more questions pop up out of the ground.
Let the litigation begin!
https://www.reuters.com/legal/silicon-valley-bank-parent-ceo-cfo-are-sued-by-shareholder-fraud-2023-03-13/
“shareholders led by Chandra Vanipenta said Santa Clara, California-based SVB failed to disclose how rising interest rates would undermine its business model, and leave it worse off than banks with different client bases.”
Did management fail to let shareholders know how they raised their funds or how they were invested? I suspect this will be a key factual issue if the shareholder lawsuit is based on this premise.
Damned woke seaweed!:
https://www.nbcnews.com/science/environment/sargassum-seaweed-threatens-beaches-florida-mexico-rcna73862
Five thousand mile wide sagasum mat headed for a tourist state where faux outrage has supplanted governance. Could get smelly.
“Poetic justice”??? The sometimes sadist asked.
Don’t get me wrong, I think this is high quality research. I think these are “trains of thought” worth taking, and “rabbit holes” worth going down. The adventure/effort on these things is all worth it. And it’s interesting, without a doubt. Having said that, do we file this in the cabinet drawer in the folder “What does it all mean??”.
I suppose the answer is “No, it means something” “Inverted yield curve is important in signaling in some countries, not much good at signaling in other countries” [ sigh ]