Higher than at previous NBER peak (2020M02):
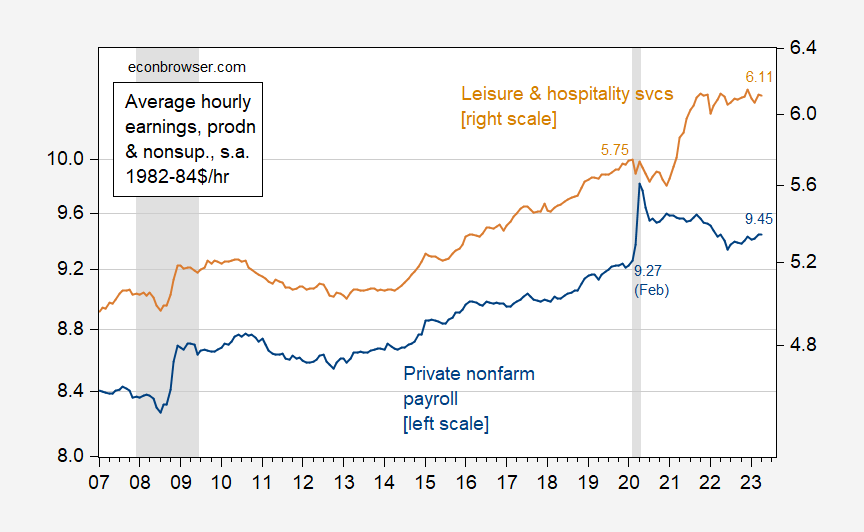
Figure 1: Average hourly earnings in total private nonfarm payroll (blue, left log scale), and in leisure and hospitality services (tan, right log scale), for production and nonsupervisory workers, in 1982-84$. NBER defined peak-to-trough recession dates shaded gray. Source: BLS via FRED, NBER, and author’s calculations.
As is well known, the CPI is upwardly biased (for a number of reasons, including it being a Laspeyres index, albeit less so over time). I show the Chained CPI version of Figure 1 below (where I’ve seasonally adjusted the log series using X13).
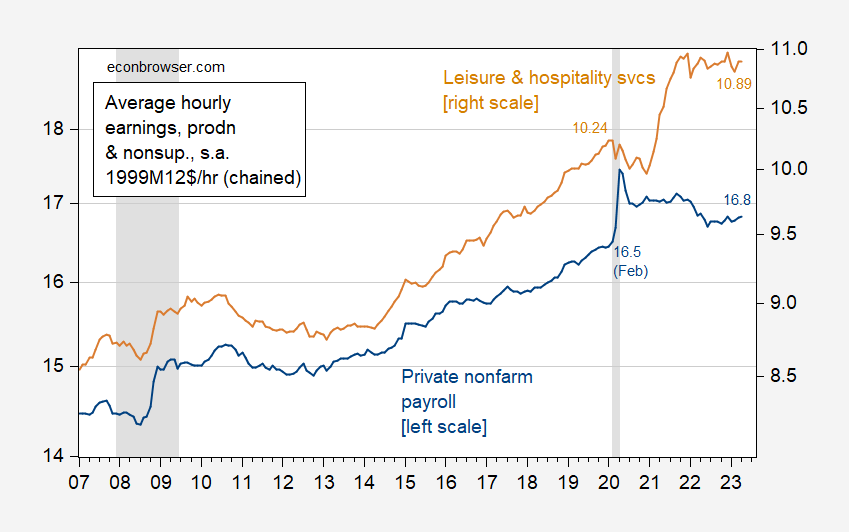
Figure 2: Average hourly earnings in total private nonfarm payroll (blue, left log scale), and in leisure and hospitality services (tan, right log scale), for production and nonsupervisory workers, in 1999M12$. NBER defined peak-to-trough recession dates shaded gray. Chained CPI seasonally adjusted by author using X13. Source: BLS via FRED, NBER, and author’s calculations.
Finally, consider the HICP deflated real wages. The HICP includes rural weights in the calculation of the price index. In addition, it does not incorporate an equivalent of the “Owner Equivalent Rent” component.
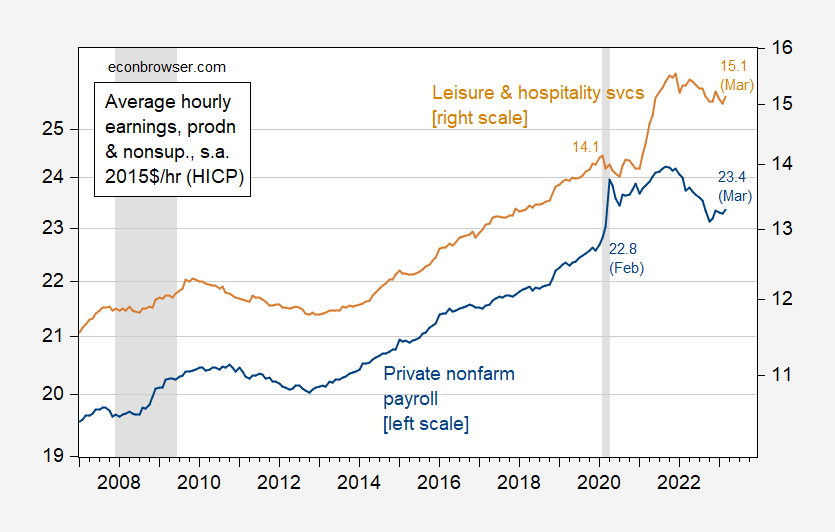
Figure 3: Average hourly earnings in total private nonfarm payroll (blue, left log scale), and in leisure and hospitality services (tan, right log scale), for production and nonsupervisory workers, in 2015$. NBER defined peak-to-trough recession dates shaded gray. Chained CPI seasonally adjusted by author using X13. Source: BLS via FRED, NBER, and author’s calculations.
Finally, what are the median usual real weekly earnings for full time workers, as derived from the Current Population Survey?
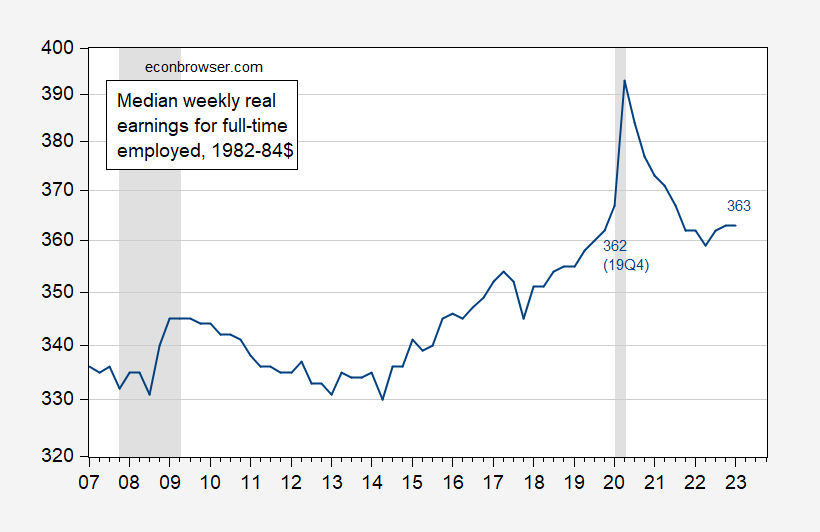
Figure 4: Median usual weekly earnings for full time wage and salary workers, in 1982-84$ (blue, on log scale). NBER defined peak-to-trough recession dates. Source: BLS via FRED, NBER.
As of 2023Q1, they are about even with the level at the previous NBER peak of 2019Q4. Note that when looking at the entire sample of workers, compositional effects are such that earnings of those employed typically rise during recessions.
“As of 2023Q1, they are about even with the level at the previous NBER peak of 2019Q4.”
About even is not the same as JohnH’s exactly the same. Your labeling of your first graph – which JohnH commented on – was more precise than how I originally read it. OK, Feb. 2020 real wages = $9.27. Most recent month real wages = $9.45.
According to little Jonny boy 9.27 is exactly equal to 9.45. Go figure!
https://fred.stlouisfed.org/graph/?g=Qe7j
January 4, 2020
Real Average Hourly Earnings of All Private and Production & Nonsupervisory Workers, * 2020-2023
* Production and nonsupervisory workers accounting for approximately four-fifths of the total employment on private nonfarm payrolls
(Indexed to 2020)
https://fred.stlouisfed.org/graph/?g=QeCl
January 4, 2018
Average Hourly Earnings of All Private and Production & Nonsupervisory Workers, * 2017-2023
* Production and nonsupervisory workers accounting for approximately four-fifths of the total employment on private nonfarm payrolls
(Indexed to 2017)
https://fred.stlouisfed.org/graph/?g=SwEq
January 4, 2018
Average Hourly Earnings of All Private and Production & Nonsupervisory Workers, * 2007-2023
* Production and nonsupervisory workers accounting for approximately four-fifths of the total employment on private nonfarm payrolls
(Indexed to 2007)
https://fred.stlouisfed.org/graph/?g=KH4x
January 4, 2018
Real Average Hourly Earnings of All Employees in Manufacturing, 2017-2023
(Indexed to 2017)
It appears that this discussion is being pushed in the direction of a debate over the correct deflator and toward certain cohorts where workers have done relatively better than other cohorts. The only graph that looks at workers in general is the median usual real weekly earnings for full time workers. It shows that earnings of full time workers have risen 0.27% since before the pandemic. Next quarter’s economic release may make it negative again.
The other charts show that average wages for the leisure and hospitality cohort, a particularly disadvantaged group, have risen 6.3% to 7%. Good for them…one of the few cohorts where a tight labor market and increased minimum wages seem to have helped. Production and non-supervisory workers have seen their wages rise, depending on the deflator, by 1.7% to 2.6% over three years.
Considering “all employees” and not special cohorts and using the CPI-U as a deflator, real average wages dropped by 1%. Not pretty.
And, as long as we’re cherry picking deflators and cohorts, I could bring in hourly earnings for manufacturing workers, which have fallen by 1.6%. How could those poor manufacturing workers have been so callously forgotten?
The bottom line here is that the welfare of workers is finally being looked at. (Yeah!) The other takeaway is that when a conclusion depends on deflators and cohorts, the precise result is inconclusive. However, inconclusive as the technical result may be, it is obvious that overall, workers are not making out like bandits. If typical workers are indeed better off now than before the pandemic (and that’s a big if,) then growth is about as anemic as you can get. If you have to rely on selected deflators and cohorts to make the case, then any definitive claim that workers real wages have been growing is about as shaky as it gets.
Now let’s put workers’ situation in context and compare it to how the economy as a whole and another, major sector have performed: In the same time frame, real per capita GDP grew 4.3% while corporate profit margins rose from 12.5% to 16.7%. In those areas, real growth is not in dispute. Neither is rising income inequality, another issue that need to be put front and center.
JohnH: Gee, and I thought FRED series AHETPI referred to all workers in private nonfarm sector (production/nonsup). Isn’t that a pretty broad category.
At least you are no longer claiming that the Federal government suppresses real median income data, as you were previously (e.g., here).
The Federal government may not be suppressing real median income data, but there are definitely problems with accessibility. Take the usual median real weekly earnings series (LES1252881600) as an example. It defines full-time workers as those working at least 35 hours a week. Other data sets reveal that the average work week is around 34 hours per week. Other federal laws define full-time as at least 30 hours a week.
The net effect is that the commonly cited series is actually the median of those workers who work more hours and consequently make more money. This results in the commonly cited “median” being overstated.
The usual earnings of the average worker–the one who works only 34 hours a week–is put into Table 6 of the quarterly release along with other workers whose hours are below average. The data for “full-time” and part-time worker is not combined. Sure, with some effort you can calculate a median for the total workforce, but that’s only necessary because the total workforce median is not published quarterly (for some strange reason.)
As far as I know, the total workforce median is published only in the annual CPS report, which now shows data from 2021.
https://www.census.gov/content/dam/Census/library/visualizations/2022/demo/p60-276/figure4.pdf
And guess what? The real median wage of the total workforce is about 80% of that reported every quarter and available on FRED in the LES1252881600. The median worker is not doing nearly as well as the quarterly released “full-time” median earnings report would have you believe.
In previous threads I’ve discussed the problems with the Real Earnings Summary. The main problem as far I can see is that it doesn’t show a median hourly wage. The technical notes say specifically that “The series are the average earnings of all employees or all production and nonsupervisory jobs, not the earnings average of “typical” jobs or jobs held by “typical” workers.” Of course you could apply a factor (80%) from the CPS report or 65% from the Social Security report https://www.ssa.gov/OACT/COLA/central.html. Applying factors with such a great divergence doesn’t exactly inspire confidence in obtaining a credible result.
Sure, my claim that the Federal Government suppresses real median income data is a bit of an exaggeration. On the other hand, I feel that it is no exaggeration to say that the Federal Government does not make real median income data for the total workforce or for the average worker readily available on a timely basis (for some strange reason.)
JohnH: “Bit of an exaggeration”? You want data on a timely basis? We get median weekly real income (series I quoted) for Q1 as of April 18th. By my count, that’s 18 days after the end of Q1.
You should just admit that you are inept at finding and interpreting statistical data. You should also allow that you are inept as a military strategist ( https://econbrowser.com/archives/2022/10/how-is-that-trap-working-out ). You are akin to the Energizer Bunny (TM) of stupidity and arrogance.
JohnH is even inept at understanding what his own links have said. I guess he actually thinks reading a headline is enough to understand what the entire article said.
Still can’t solve the AVERAGE problem and the increasingly upward bias of the data due to increasing income inequality at the high income part of the data set, can you?
Social Security data shows that the upward skew has been rising over time, which makes it problematic to use the average as a way to estimate real wage growth–how much is real wage growth, and how much is due to increasing upward bias? This is particularly problematic when wage growth has been so paltry.
What puzzles me is why some folks are so committed to showing that real wages are rising? They cling to even the most anemic growth, manipulated by using selected deflators and subsets.
I would have thought instead that these folks would want to prove that real wages are falling and use that as an argument for the Fed to lower interest rates.
It seems to me that the narratives are in conflict.
“JohnH
May 12, 2023 at 10:47 am
“Still can’t solve the AVERAGE problem and the increasingly upward bias of the data due to increasing income inequality at the high income part of the data set, can you?”
Jonny boy provided a data source that Jonny boy never understood. It turns out that whether one picks the period since Feb. 2020 or the last decade – his own source properly used shows that the real wages of the lower quartile have grown more than the real wages of the top 10%.
I have a suggestion – require Jonny boy to do actual research before this worthless troll spews more of these stupid lies.
Since JohnH thinks the ONLY way to do this is real average weekly earnings and you have presented real average hourly earnings, it was wondering how this have behaved over time:
https://fred.stlouisfed.org/series/AWHAETP
Average Weekly Hours of All Employees, Total Private
It does seem to have been rather volatile of late. Now why one would focus on wages per week versus wages per hour when the number of hours worked per week can vary is beyond me. And I doubt JohnH has a coherent explanation.
pgl doesn’t understand what the median is!! What a hoot! Or maybe pgl realizes that averages can be deceptive, which is why he is so fond of them.
Let me give an example. In 2021 according to CPS the median earnings of American workers was $45,470 [ibid] or $874 per week. That amounts to $20-25 per hour. Half of the work force is trying to make ends meet on less than that.
Social Security [ibid] reports the median wage in 2021 is less than that: $37,586.03, or $722.
Yet the BLS want us to believe that in 2021, median weekly earnings were about $1000 or $52,000. They get this number only by publishing results from the relatively highly compensated subset of the total workforce that works at least 35 hours a week…leaving out the average worker, who works 34 hours a week along with those who work less.
“The living wage in the United States is $25.02 per hour, or $104,077.70 per year in 2022, before taxes for a family of four (two working adults, two children), compared to $24.16, or $100,498.60 in 2021.” About half of American workers do not make that much, information that is hidden by the frequently reported and readily accessible median and average earnings reports.
The real question is why so many mainstream economists are so reluctant to notice how poorly the average American worker is faring.
I know the difference between the mean and the median. But I also know you are flailing like a lost kite. You make statements that are blatantly false and when corrected you run off to something else. One would think someone who has embarrassed his own family so many times with your incessant lies that have been called out – you would stop.
But wait – a new post calling you out. Which means you are far far ahead of the other lying dorks here that you will assuredly win the 2023 troll of the year. Well done!
For weeks the discussion was about the change over a period of time of real wages for one group or another. Jonny boy provides a data set that would allow one to look at the real wages by quartile and for the top 10%. Jonny boy made the false claim that the latter got a high increase but Jonny boy’s own data set that they got a lower increase over the period Jonny boy picked. Of course this is no surprise because Jonny boy never does the hard work and even if he did – he would not know what on earth he was doing.
So what does Jonny boy do? Change the subject, hurl pointless insults, and now little Jonny boy decides to look at levels as he now realizes his false claims about changes have been exposed to be stupid lies.
Yea Jonny boy does this garbage all the time. Which is why everyone here makes fun of this worthless stupid troll. Then again the other 4 year olds in Jonny’s preK class make fun of Jonny boy all the time.
“About half of American workers do not make that much, information that is hidden by the frequently reported and readily accessible median and average earnings reports.”
Now you claim data is frequently reported? Check out the new post mocking you. After all – you actually think the BLS is supposed to report this data on a daily basis.
JohnH – Stupid Troll Alive!
https://fred.stlouisfed.org/graph/?g=ZksD
January 15, 2020
Real Median Weekly Earnings, * 2020-2023
* All full time wage and salary workers
(Indexed to 2020)
https://fred.stlouisfed.org/graph/?g=ZksN
January 15, 2020
Real Median Weekly Earnings for men and women, * 2020-2023
* Full time wage and salary workers
(Indexed to 2020)
https://fred.stlouisfed.org/graph/?g=Zktb
January 15, 2020
Real Median Weekly Earnings for White, Black and Hispanic, * 2020-2023
* Full time wage and salary workers
(Indexed to 2020)
“Next quarter’s economic release may make it negative again.”
Or not. This is one of those things dishonest people say when they don’t have a better trick handy. Could be next quartes economic release (which one is that, exactly, Johnny, ’cause there are a bunch of relaeses every quarter?) could do the opposite. C’mon, Johnny, a C- effort really won’t cut it.*
*Grade inflation is ubiquitous.
“It appears that this discussion is being pushed in the direction of a debate over … ”
Debate? You do not debate. You whine. You lie. You change the subject when caught lying. mLord – you are indeed the biggest waste of time EVER!
“The only graph that looks at workers in general is the median usual real weekly earnings for full time workers. It shows that earnings of full time workers have risen 0.27% since before the pandemic.”
Weekly not hourly? That’s the only graph you care about. Oh wait – you claimed the real wages portrayed in the first graph were EXACTLY where they were in Feb. 2020. A little arithmetic homework for Jonny boy. 9.45/9.27. Oh gee – a 1.9% increase which little Jonny boy wanted to claim was zero. DAMN – YOU ARE STUPID.
“as long as we’re cherry picking deflators and cohorts”
Jonny boy claimed earlier than Dr. Chinn was cherry picking and now he repeats this smear? No Jonny boy – cherry picking is your game. The snide insults towards our host are dishonest and dumb. But hey – that is our Jonny boy.
The ruling against the pork industry is interesting enough but check out who agreed and who dissented. Not your usual liberal v. conservative divide!
https://abcnews.go.com/Politics/supreme-court-upholds-california-ban-unethical-pork-proposition/story?id=99256802
Supreme Court upholds California ban on ‘unethical’ pork, Proposition 12
The 5-4 decision was hailed as “watershed moment” for animal welfare.
The U.S. Supreme Court on Thursday rejected a challenge to California’s Proposition 12, a statewide ban on the sale of pork from pigs housed in cages or crowded group pens that prevent them from turning around freely.
The ruling, which animal welfare advocates hailed as a “watershed moment,” could have a major impact on thousands of farmers, millions of pregnant pigs — and the prices Americans pay at the grocery store for one of the country’s most popular meats. Justice Neil Gorsuch, writing for a five-justice majority, said that California voters overwhelmingly endorsed the “ethical pork” law in 2018 and have the right to decide what products appear on store shelves …. Chief Justice John Roberts and Justices Samuel Alito, Brett Kavanaugh and Ketanji Brown Jackson dissented in part from the Gorsuch opinion.
That may not be as simplistic as it appears. I believe the ban only covers one state. So if you’re a judge who goes around giving lip-service to states’ rights then you’re going to be more apt to go along with the ban. My guess is Supreme Rapist Kavanaugh and Justice Alito want to put a federal level ban on abortion, so…… That’s coming from someone who only took two 101 level law classes in college so…… It would be interesting to read Jackson’s individual thoughts on it though. She’s the true “outlier” here.
This has an interesting mix of states rights vs free commerce issues mixed into it.
https://www.nytimes.com/2023/05/11/us/supreme-court-california-pigs.html
May 11, 2023
Supreme Court Upholds California Law on Humane Treatment of Pigs
The court ruled that the measure did not violate constitutional limits on state laws that affect conduct beyond the state’s borders.
By Adam Liptak
The Supreme Court on Thursday upheld a California law that sought to address cruelty to animals, saying the state could require pork sold there but produced elsewhere to come from breeding pigs housed in spaces that allow them to move around freely.
The decision was badly fractured and featured competing rationales, but the basic vote was 5 to 4. In a controlling opinion, four justices said that the pork producers challenging the law failed to make the case that it imposed a substantial burden on interstate commerce.
Justice Neil M. Gorsuch, here writing for five justices, set out the main issue. The challenged law, he said, prohibited “the in-state sale of certain pork products derived from breeding pigs confined in stalls so small they cannot lie down, stand up or turn around.”
It is true, he went on, that “no state may use its laws to discriminate purposefully against out-of-state economic interests.” But the California law, he wrote, did not offend that principle….
“The decision was badly fractured and featured competing rationales”
I have not followed this issue in part because I don’t eat pork. But given how this 5-4 vote came down makes me wonder what drove these competing rationals. Moses has a few insights but maybe I should read the opinions.
I have only lightly skim read it myself. Some might find it dry reading, others might find the “scattered” issues in a single case fascinating:
https://www.supremecourt.gov/opinions/22pdf/21-468_5if6.pdf
I don’t view animals as having “souls” so, I don’t find a little rough treatment as terribly bothersome. It’s the cleanliness issues that would be my worry, I assume the tighter you pack them up they create more germs, disease, shit and it becomes more difficult to have a clean end product.
I sometimes see a kindly (and seemingly lonely) older lady pushing a purple baby carriage on the residential streets with a pug nose dog in the baby carriage. I keep pondering saying hello to her and starting a conversation in hopes of assuaging her loneliness, but I am a selfish SOB in some aspects. And my worry of getting caught up in a 20 minute convo that I got bored with 2 minutes in and cannot extricate myself from stops me from extending the friendliness to her. That doesn’t say much for me as a human being, but I am afraid that is the way it is.
But you can just see in her eyes, and kindliness, the older lady walking her pug nose dog in the purple baby carriage would side with more walking space for the piggies.
‘It appears that this discussion is being pushed in the direction of a debate over the correct deflator’ – Jonny boy. Dr. Chinn:
‘Finally, consider the HICP deflated real wages. The HICP includes rural weights in the calculation of the price index. In addition, it does not incorporate an equivalent of the “Owner Equivalent Rent” component.’
Let’s see. 23.4/22.8 represents a 2.63% increase!
The more Jonny boy tries to defend his false claim that real wages now are EXACTLY where they were as of Feb. 2020, the worse it gets for him.