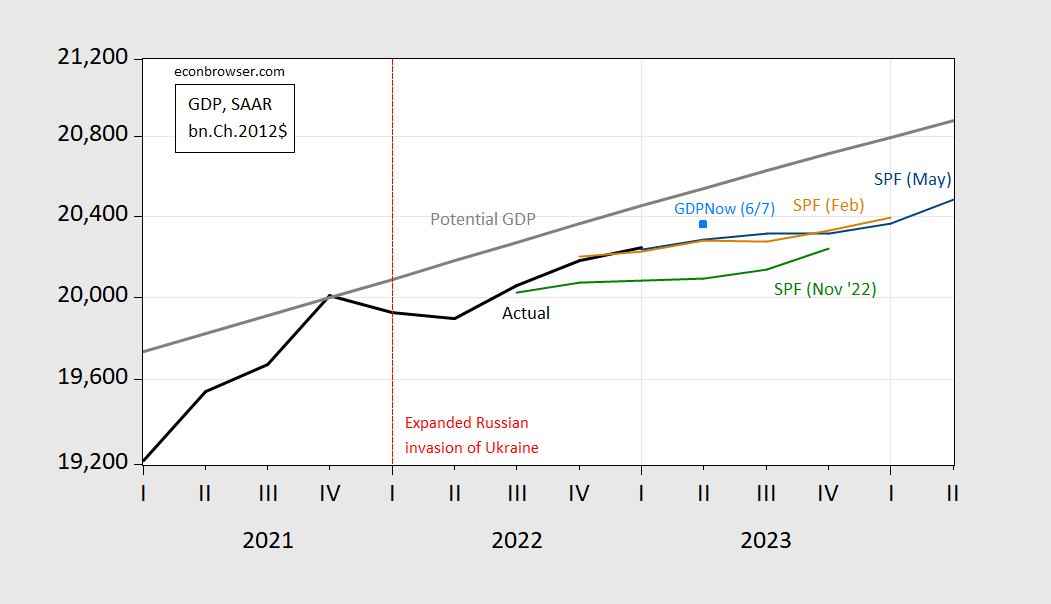
The pattern of forecasts from the Survey of Professional Forecasters over the past three quarters suggests a receding downturn. Today’s Atlanta Fed’s GDPNow for Q2 seems to confirm that no downturn occurred in 2023Q2.
Figure 1: GDP (bold black), Survey of Professional Forecasters May median (blue), February median (tan), November 2022 median (teal), and GDPNow of 6/7 (sky blue square), all in billions Ch.2012$ SAAR. Source: BEA 2023Q1 2nd release, Philadelphia Fed, Atlanta Fed and author’s calculations.
As of today, S&P Global Market Insights formerly IHS Markit/Macroeconomic Advisers says 2.8% in Q1, 0.8% in Q2 (SAAR). GS tags Q2 growth at 1.7% (final sales at 2.1%).
In forecasts more recent than the May SPF (those forecasts are gathered at the end of April), Yang et al. at DB today note that their growth tracker for final sales is moving toward zero in Q2 “Surveys say: Growth near stall speed, not yet negative”.
That perspective is consistent with my view (based on term spread models, among other things) that a recession would more likely start in 2023Q3-Q4 (here I’m assuming the growth slowdown occurs as the same time as other broad indicators like employment and income decline). That was also the modal response in the last FT-IGM survey taken in mid March. The FT-IGM survey will come out soon, and we’ll see

https://jabberwocking.com/is-inflation-already-down-to-3/
Kevin Drum finds two interesting papers on inflation which are suggesting it may be less than 3.5%.
Just a couple of data sets that may have a bearing on the economy.
The PCE price index was up slightly in April versus March.
https://www.bea.gov/data/personal-consumption-expenditures-price-index
And Personal Savings as a percentage of disposable income has been lower than the past decade (after the blip from Treasury outlays during COVID). Q1 2023 less than half the rate of Q4 2019.
https://fred.stlouisfed.org/series/A072RC1Q156SBEA
While this doesn’t explain everything that’s fueling the continued economic levels, it does seem to pose the question of how long personal consumption will be funded at higher levels by savings rather than disposable income.
“The PCE price index was up slightly in April versus March.”
“it does seem to pose the question of how long personal consumption will be funded at higher levels by savings rather than disposable income.”
You asked the question our host has already answered in his new post.
Gee Bruce – inflation is FAR below your stupid 13% claim.
https://www.nytimes.com/2023/06/07/business/economy/debt-ceiling-borrowing-binge.html
June 7, 2023
A $1 Trillion Borrowing Binge Looms After Debt Limit Standoff
The government has avoided default, but the effects of the debt-ceiling brinkmanship may still ripple across the economy.
By Alan Rappeport and Joe Rennison
The United States narrowly avoided a default when President Biden signed legislation on Saturday that allowed the Treasury Department, which was perilously close to running out of cash, permission to borrow more money to pay the nation’s bills.
Now, the Treasury is starting to build up its reserves, and the coming borrowing binge could present complications that rattle the economy.
The government is expected to borrow around $1 trillion by the end of September, according to estimates by multiple banks. That steady state of borrowing is set to pull cash from banks and other lenders into Treasury securities, draining money from the financial system and amplifying the pressure on already stressed regional lenders.
To lure investors to lend such huge amounts to the government, the Treasury faces rising interest costs. Given how many other financial assets are tied to the rate on Treasuries, higher borrowing costs for the government also raise costs for banks, companies and other borrowers, and could create a similar effect to roughly one or two quarter-point rate increases from the Federal Reserve, analysts have warned.
“The root cause is still very much the whole debt ceiling standoff,” said Gennadiy Goldberg, an interest rate strategist at TD Securities….