Here’s a picture of employment, normalized to 2022M03.
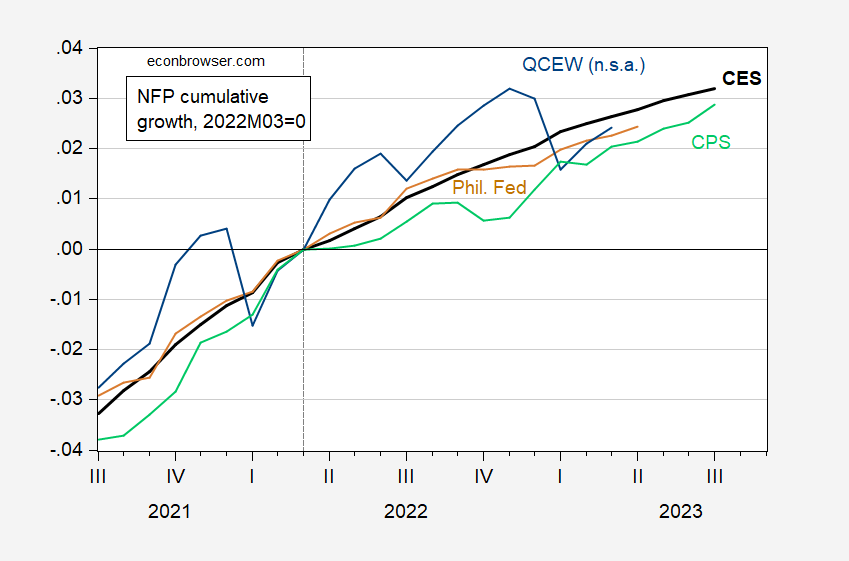
Figure 1: Nonfarm payroll employment from CES (bold black), from CPS adjusted to NFP concept (light green), from Philadelphia Fed early benchmark (brown), all s.a., and from QCEW, n.s.a. (blue), all in logs 2023M03=0. Source: BLS via FRED, BLS, BLS/QCEW, Philadelphia Fed, and author’s caclulations.
While QCEW indicates a slightly lower cumulative growth than the official NFP series, it is only slight less through March (2.4% vs. 2.6% official, and 2.3% from Philadelphia Fed). Since the graph is in logs, the flattening of the curves indicates deceleration.
Another way of seing the trajectory of employment is to look at year-on-year growth rates (calculated in log differences), which addresses the seasonality issue.
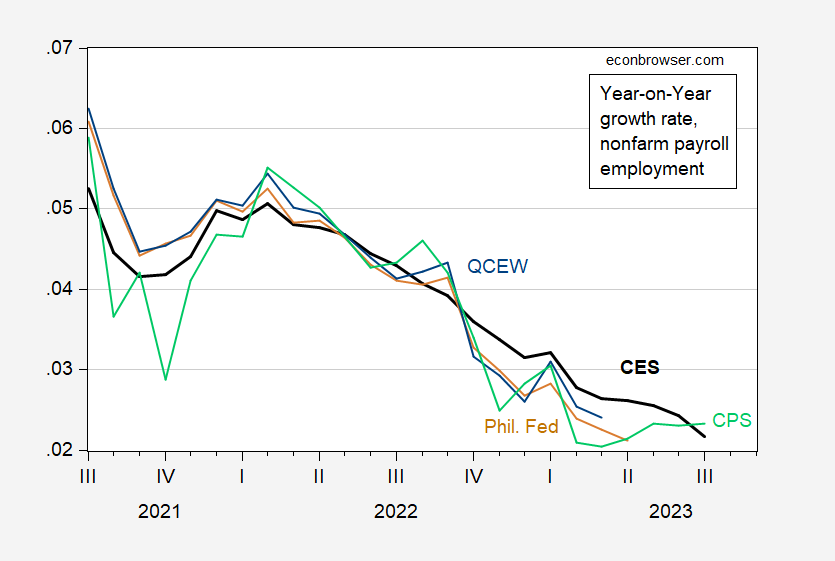
Figure 2: Year-on-year growth rate of nonfarm payroll employment from CES (bold black), from CPS adjusted to NFP concept (light green)., and from QCEW (blue). Source: BLS via FRED, BLS, BLS/QCEW, Philadelphia Fed, and author’s caclulations.
BLS notes that the implied benchmark revision to NFP is down by 306K.
Two takeaways:
1. For now, the big stagnation in Q4 2022 has held up.
2. The household report on an average seems to continue to come closer tot he QCEW “gold standard” than the establishment report. Nevertheless, through Q1 employment continues to rise at a decent clip.
Thanks for the update.