Long term real rates predicted, and r*.
From the market, and from the CBO. BOth are predicting real rates will rise (although the market indicators seem to have been way off in the past few years).
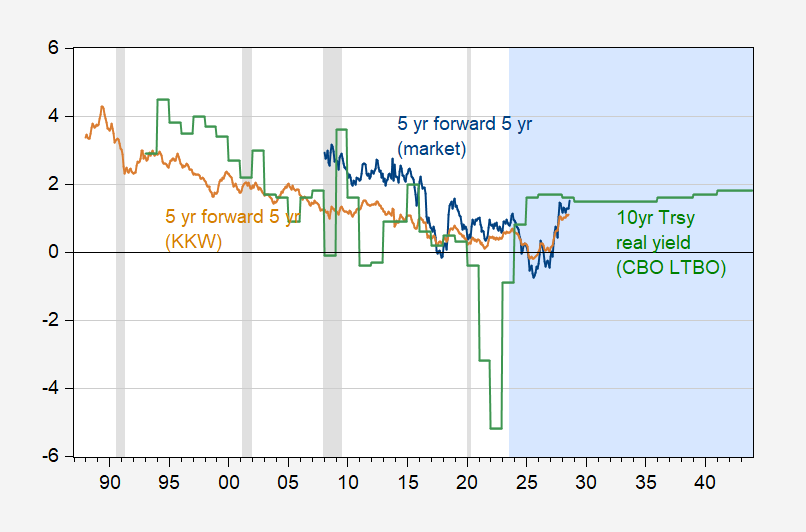
Figure 1: 10 year real Treasury yield from CBO Long Term Budget Outlook (green), and 5 year 5 year forward real rate from market, using Survey of Professional Forecasters 10 year inflation median forecast (blue), adjusted from KKW (tan). August 2023 reading for market forecast uses data through August 14. Light blue shading denotes projection period. NBER defined peak-to-trough recession dates shaded light gray. Source: CBO, Treasury via FRED, Philadelphia Fed, KKW, NBER, and author’s calculations.
What about r*, the rate that sets output at potential output? And here are two estimates of r*, from Baker et al. at the NY Fed.
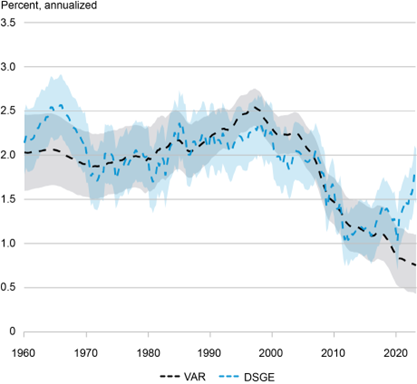
Figure 2:r* estimates from VAR and from DSGE, as described in Baker et al. (2023).
Clearly, as discussed in the article, there is some disagreement. The DSGE approach indicates a move back toward pre-2000 levels, while the VAR indicates that the drop could be persistent.
“And here are two estimates of r*, from Baker et al. at the NY Fed.”
Let’s note that Macroduck introduced us to Baker et al. This post should also be read in conjunction with the guest post from Dr. Frankel.
Maybe we should create a new rule. Call it the “Dopey Head Moses Herzog” rule. “Rates change according to whatever the current context is and of any context’s nearly innumerable variables. Let this be the whole of the Dopey Head* rule” What?? You say I’m retarded?? OK, nevermind.
*created by a goofball straddling the 20th and 21st centuries.
The NY Fed article, in looking for an explanation of the divergence between the VAR model forecast and the DSGE forecast, observes:
“…it appears that in the DSGE, movements in short-run r* tend to have some information for longer run measures, while in the trendy VAR this information is ignored.”
If the information being picked up by the DSGE model but not by VAR model is mostly about Covid-era features of the economy, then we are back to the same culprit that shows up in our efforts to explain labor market performance, inflation performance, the yield curve’s apparently mistaken recession signal and so on. (Say it with me: This time really is different!)
If these same two models revert to producing similar forecasts once the short-term no longer reflects Covid-era oddities, then “Covid oddities” will look like the right answer.
Even if that is the right answer, I’m not sure it tells us which forecast is more likely to be correct. We’ll find out with time, of course Then we’ll want to know what we’ve learned – about the economy and about foecasting using these two models.
The NY Fed article promises a subsequent article on short-run r*. Here it is:
https://libertystreeteconomics.newyorkfed.org/2023/08/the-evolution-of-short-run-r-after-the-pandemic/
From the short-run r* article:
“We show that, from the model’s perspective, short-run r* has increased notably over the past year, to some extent outpacing the large increase in the policy rate. One implication of these findings is that the drag on the economy from recent monetary policy tightening may have been limited, rationalizing why economic conditions have remained relatively buoyant so far despite the elevated level of interest rates.”
Nice little “that explains a lot” statement. The article is a pantry full of food for thought.