Or, why I still think a recession is possible at 2024H1.
The BIS has just released debt-service ratios for 2023Q1. Using this variable, and term spread and foreign term spread, the estimated probability of a recession in 2024Q1 has risen substantially, although still far below the corresponding figure using only a term spread/short rate.
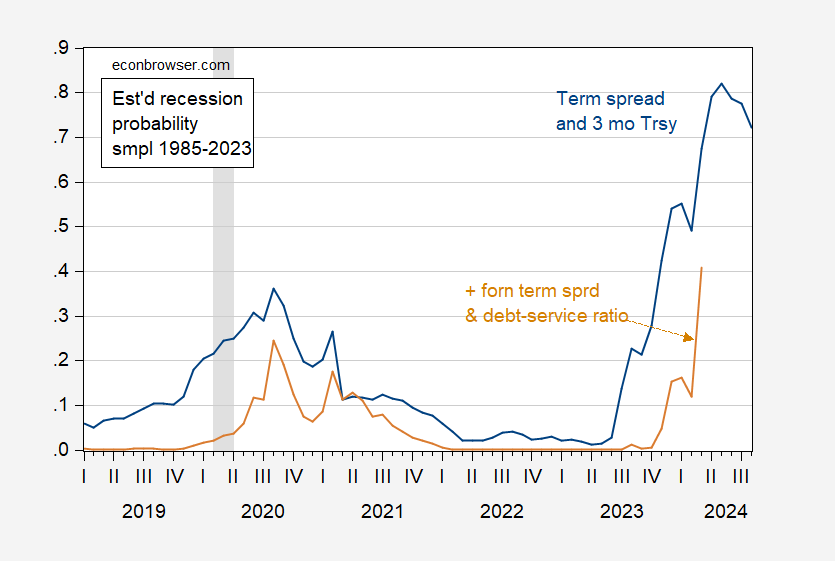
Figure 1: Estimated probability of NBER-defined recession using 10yr-3mo term spread plus 3 month Treasury rate (blue), and specification augmented with foreign term spread and debt-service ratio (tan). Debt-service ratio is for private nonfinancial sector. NBER defined peak-to-trough recession dates shaded gray. Source: Author’s calculations and NBER.
The increase in estimated probability for being in a recession month in rose from 12% in 2024M02 to 41% in 2024M03. This highlights the fact that the probit regression involves estimating a nonlinear relationship between the dependent and independent variables. The increase in debt-service ratio looks pretty modest.
That being said, the augmented specification implies a probability far below that from the term-spread and short rate only specification (in March 2024, it’s 68%, compared to 41% from the augmented specification). For motivation for use of debt-service ratio as a proxy for the financial cycle a la Borio-Drehmann-Xia, and the foreign term spread a la Ahmed-Chinn, see this post. Additional cross-country analysis in work with Laurent Ferrara in slide deck here.
Figure 2 depicts the evolution of the term spread and the debt-service ratio for the private nonfinancial sector.

Figure 2: 10yr-3mo Treasury spread, % (blue, left scale), and debt-service ratio, % (tan, right scale). NBER defined peak-to-trough recession dates shaded gray. Source: Treasury via FRED, BIS, NBER, and author’s calculations.
Note that the term spread went more negative in 2023Q1 as the debt-service ratio rose. The increase in estimated probability in the un-augmented specification was 18 percentage points, and 29 percentage points for the augmented.
One might ask why one should prefer the augmented specification over the the unaugmented. The pseudo-R2 for the term spread plus short rate specification (1985-2023M08) is 0.28, while that for the debt-service and foreign term spread is 0.60. (Debt-service alone has a pseudo-R2 of 0.32, but implies essentially zero probability of recession in 2024M03).
In addition, the augmented specification captures 3 out of 4 recessions during the sample period, using a 50% threshold (missing the 2020 recession). A term spread plus short rate catches only the 2001 recession, while a debt-service ratio alone specification misses all four (coming close for the 2007-09 recession). Using a 40% threshold reduces the discrimination between the models, with both the term spread plus short rate and the augmented catching 3 out of 4 recessions (debt-service ratio only catches the 1990-91 and 2007-09 recessions). All specifications miss the 2020 recession.
An interesting aside: Even if you think the term spread is no longer a reliable predictor (e.g., Putnam), that doesn’t mean you can relax.
So, while the “soft landing” view is gaining dominance, the above results are consistent with the view of a downturn in 2024H1, which garners about 53% in the FT-Booth School macroeconomists survey:
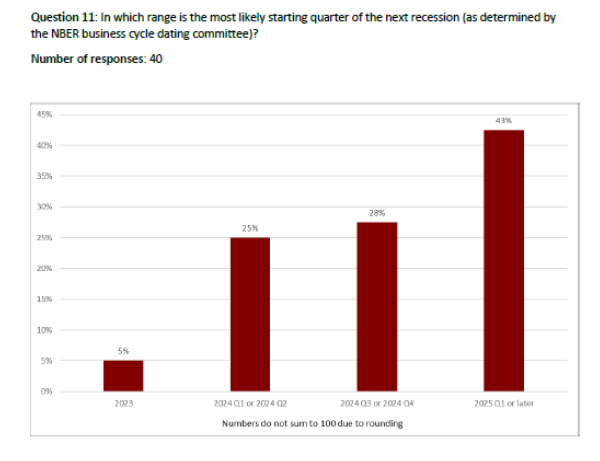
Source: Booth School (September 2023).
Note that some analysts are forecasting a downturn while acknowledging such a downturn might not meet NBER criteria — e.g. Oxford Economics.
I watch the federal reserve, weekly quantitative tightening and daily reverse repo operations.
After two weeks of small tightening fed took $75 billion off the assets account week of 20 Sept.
But today rev repo only took $1.42 trillion a slight less draw on liquidity. Note rev repo are historical highs.
Not sure what signal from short term ops
Don’t know, either, but the Fed did just have a rate announcement, and those sometimes lead to imbalances in markets in which the Fed operates.
https://oilprice.com/oil-price-charts/#prices
Brent and Urals prices continue to fall. It seems another Princeton Steve forecast did not even come close. Oh well – he is now telling us he understands the Russian macroeconomy by looking at Taylor Rules for the US. Yea – as bad as he is at oil price forecaster, he is much worse at basic macroeconomics.
The 2020 recession was not well anticipated by fixed-income markets, probably because pandemic was not on the radar of market participants. No points off for missing that one.
It strikes me that the yield curve’s predictive ability comes mostly from market expectations, while the debt-service ratio is actually causal. The predictive capacity of the debt-service ratio also lines up with the Mian-Sufi-Werner stuff on household debt and consumption driving economic cycles.
And yeah, it’s worrying that real-side factors now line up with fixed-income market expectations in predicting recession.
Why debt service ratio? The primary driver of a change in debt service ratio is interest rates as determined by the Federal Funds Rate, with some lag. There should be no mystery why a rapidly rising Federal Funds Rate is often followed by a recession since that is the intended result.
Try plotting the Federal Funds Rate and you will see pretty much the same picture as debt service ratio since they are closely linked.