Some commentators have focused on the sharp declines in civilian employment as well as the ISM services employment diffusion index as signaling greater weakness than suggested by the establishment survey.
In particular, the fact that the BLS birth-death model is accounting for a large share of total growth is worrying (see Forbes, e.g.). In point of fact, the level of NFP has been revised downward for the last three months.
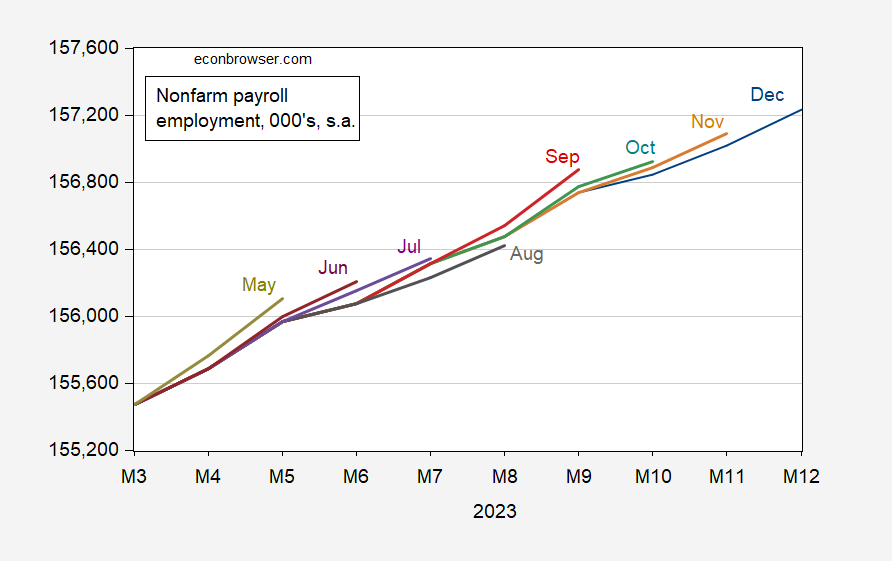
Figure 1: Nonfarm payroll employment, from various vintages. Source: BLS via FRED.
Tabulation of the numbers from the birth-death model are here.
The argument of overall weakness in the labor market is illustrated by the differing behavior of the NFP from the BLS establishment survey (blue line), where in this case I have incorporated the preliminary benchmark revision into the level of NFP. In contrast, civilian employment from household survey (green line), and the diffusion index component from the ISM PMI services index (tan line, left scale, below 0.5 is contraction), both took a big dive.
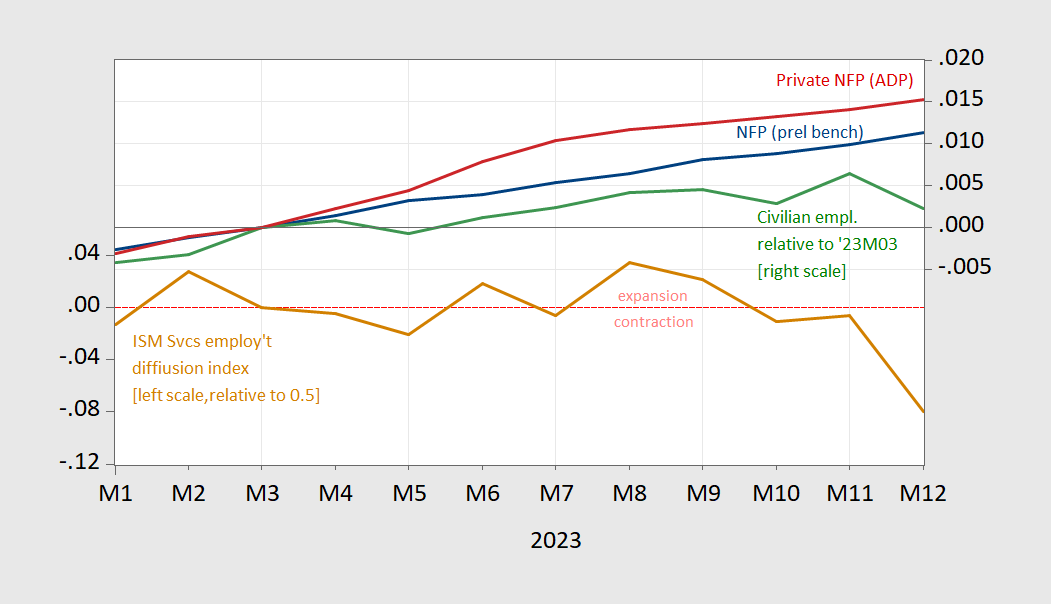
Figure 2: ISM PMI services employment diffusion index (tan, left scale, below 0.5 is contraction), NFP preliminary benchmark (blue, right scale), private NFP from ADP (red, right scale), and civilian employment from BLS household survey (green, right scale), all in logs 2023M03=0. Source: ISM via TradingEconomics.com, BLS and author’s calculations, ADP via FRED, BLS via FRED, and author’s calculations.
So, adding the PMI measure into the mix leads to a picture of a weaker labor market than otherwise. On the other hand, the ADP measure, which continued to rise in December, is not based on a survey, but on actual check-cutting data. The fact that it is rising in step with the BLS establishment survey provides additional support to the view that employment growth is continuing.
Further note that the Philly Fed’s early benchmark, which incorporates Quarterly Census of Employment and Wages data shows continued growth (in line with NFP) through June (which, admittedly, is 6 months ago).
“In particular, the fact that the BLS birth-death model is accounting for a large share of total growth is worrying…”
Perhapsso, but there is reason to think the model is working as it ought to, even if it reaches the wrong conclusion. There are lots of new firms being started, accounting for high “births”:
https://fred.stlouisfed.org/graph/?g=1dLd4
“Deaths” are harder to track, but bankruptcy filings suggest deaths are up, too:
https://www.spglobal.com/marketintelligence/en/news-insights/latest-news-headlines/us-corporate-bankruptcies-fall-in-november-with-34-new-filings-79694316
However, any increase in job loss through firm death is not showing up as initial jobless claims:
https://fred.stlouisfed.org/graph/?g=1dLdE
Yardeni gives a look at the BLS measures of employment diffusion, both overall (moderately healthy at 59.6) and factory (unhealthy at 47.9):
https://yardeni.com/charts/employment-bls/
The same set of charts also gives a look at the birth/death adjustment.
FRED doesn’t appear to have the diffusion data. I didn’t check for birth/death data.
Fascinating and thanks for posting Menzie and additional comments Macroduck! For my day job, I track demographics of individuals with disabilities in Wisconsin. The percentage of adults with disabilities seems to be increasing in Wisconsin (mostly because of an aging population and lack of both domestic and international migration to the state -i.e., WI population growth is slowing down.) https://www.cdc.gov/ncbddd/disabilityandhealth/impacts/wisconsin.html The problem with this data is a lag in presentation (data from 2021!) and I wonder what impact the increase in disabilities from long Covid will have on these statistics. (also – don’t be an anti-science know nothing – get the latest Covid vacine booster – hard to believe that the citizens of Florida would allow Gov DeSantis to appoint a anti-vaccine quack to be surgeon general https://www.theguardian.com/us-news/2024/jan/04/florida-surgeon-general-covid-vaccine-misinformation-joseph-ladapo)
If anyone needs a reminder that JohnH has been a lying worthless troll for many years, check out his link to Mark Thoma’s US Tariffs are an Arbitrary and Regressive Tax ala SEVEN years ago.
There was a good discussion going on before JohnH decided to launch into his misrepresentations and general pointless insults. All to defend tariffs which of course are regressive. But Jonny boy wants to pretend he’s the progressive? Yea – this moron has been lying for many years. And to top it all off – this is the one place where this jerk claims I’m for taxing the poor and not the rich? The stupidity burns.
FWIW, I have downplayed the big decline in employment in the household report. Basically, about 850,000 people went from employed to not even in the labor force, virtually identical to the decline in employment itself. That’s 0.85% of the entire labor force. Big declines like this have only happened on average about 1x per 2 years over the entire 50 year history of this metric.
Delving deeper, there is a very good “extended” unemployment metric, “not in labor force, want a job now” in the Household Survey. That did increase a hefty 330,000, but the other half a million workers just vanished!
So it could be we find out population growth has been overestimated recently.
But another thing that happened is that withholding tax comparisons YoY, which have been up stoutly almost all this year, fell off a cliff in December. As in, down over 10%. One way that could happen is if an anomalously large number of well paid employees sailed off into the sunset, so no longer were paying payroll taxes. More likely there might have been a big downturn in holiday bonuses YoY. California does keep track of that, but while their collections softened, they were still up 1% YoY in December. Last year they reported a big surge in holiday and stock market bonuses, so the anomaly might actually have been in 2022, throwing off the seasonal adjustment comparison in 2023.
In other words, I think we have to wait for the other (seasonal) shoe to drop next month in order to make sense of this.
There’s another thing with respect to JohnH dusting off some EconomistView post from 7 years ago beyond his pathetic lying about what I wrote. This faux progressive actually defended regressive tariffs with a really stupid claim that credit card interest rates were generally higher than tariff rates. Besides the apples and oranges stupidity of this retarded claim, Jonny boy again could not be bother with facts such as that at the time the measured averaged credit card interest rate was 12.5%:
https://fred.stlouisfed.org/series/TERMCBCCALLNS
OK 12.5% seems high but Trump was about to give us 25% tariff rates. Which of course little Jonny boy likely supported as he is really THAT STUPID.