Reader Bruce Hall notes the correlation between Fed funds rate peaks and recessions, as a counterpoint to my use of spread inversions.
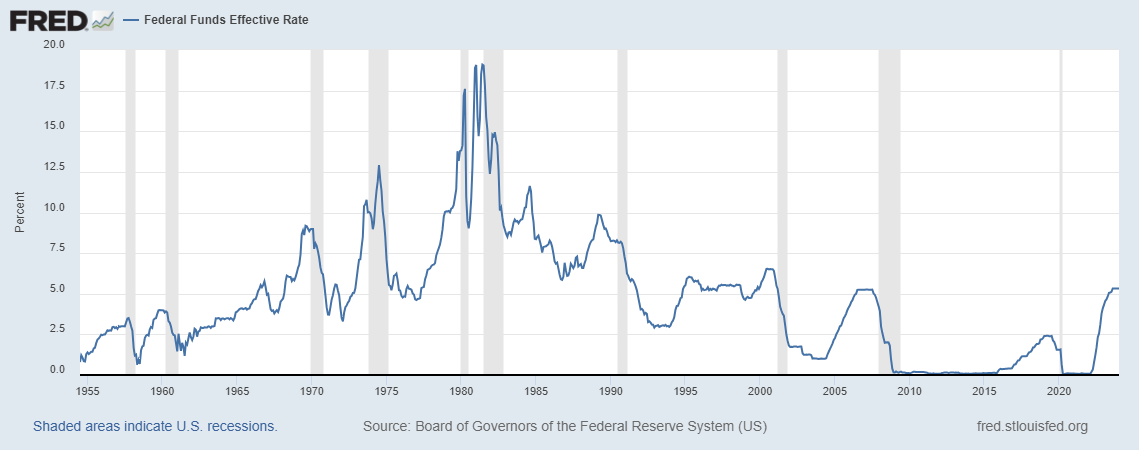
Let’s compare peaks to inversions:
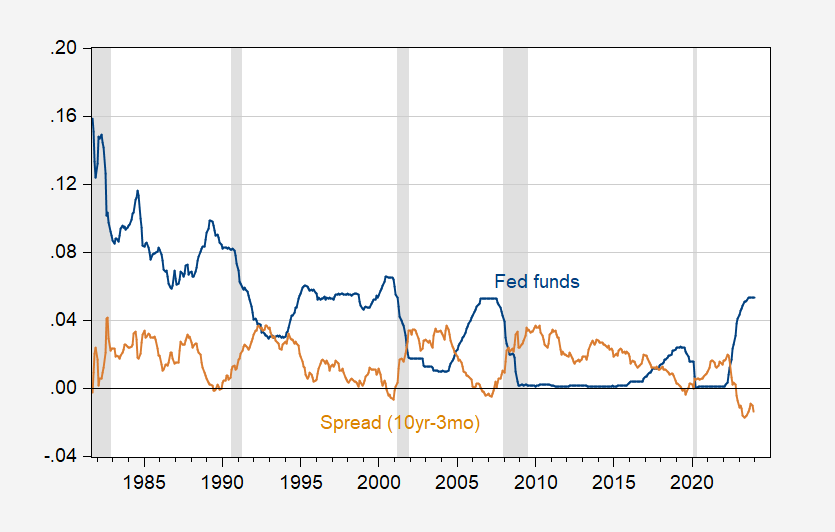
Figure 1: Fed funds (blue), and 10yr-3mo Treasury spread (tan). NBER defined peak-to-trough recession dates shaded gray. Source: Treasury, Fed via FRED, NBER.
Inversions and peaks precede recessions. Which one does better as a single predictor? I assess using a standard probit regression.

Figure 2: Probit regression on recession lead by 12 months on Fed funds (blue), and on 10yr-3mo Treasury spread (tan). NBER defined peak-to-trough recession dates shaded gray. Source: NBER, and author’s calculations.
The probit regression on the Fed funds has a pseudo-R2 of 0.07, while that on the spread has a pseudo-R2 of 0.27.
For my part, I’ll stick to the spread.
For non-specialists, just a point about the relationship between the fed funds rate and the inversion of term spreads (aka yield curve inversion).
The yield on short-maturity debt is dictated mostly by monetary policy – which is to say, by the fed funds rate. So when using the term spread as a recession predictor, we are incorporating the fed funds rate more or less directly.
Term spread includes the yield on some longer-term debt instrument, most often the ten-year Treasury rate. Term spread analysis involves information from both short-term debt and long-term debt – more information. The much better R2 (pronounced “r square”) for the term premium means we get additional information from including longer-term debt.
What is the nature of that information? Longer-term interest rates reflect investors expectations of future inflation, future short-term borrowing costs and future credit demand. An inverted curve indicates that investors expect lower inflation, lower short-term borrowing costs and lower credit dmand in the future. Historically, recessions lead to lower inflation, short-term borrowing costs and credit demand.
That’s why term spreads work better to predict recessions than does the Fed finds rate alone. End of boring lecture,
Is it really fair to expect little Brucie to get basic statistics? After all he and his BFF JohnH still struggle with basic division as in calculating debt relative to GDP or per capita income.
But let’s check. Brucie – do you know what the term R-squared even means? Or that a calendar year is 12 months not 17?
I’ll just offer up a slightly different view of term spreads as a predictor of recessions as opposed to rapid increases in the Fed funds rate.
https://www.clevelandfed.org/-/media/project/clevelandfedtenant/clevelandfedsite/publications/economic-commentary/2018/ec-201806-can-yield-curve-inversions-be-predicted/ec201806.pdf
Summary
With the recent fl attening of the yield curve, economists
and policymakers are currently discussing the likelihood
of a yield curve inversion. In this Commentary, I study the
historical forecastability of yield curve inversions. I fi nd that
professional forecasters failed to predict the beginning of the
yield curve inversions prior to the 1990–1991, 2001, and
2008–2009 recessions. These failures were largely driven
by failures to predict the magnitude of the rise in short-term
interest rates. In addition, forecasters overpredicted longterm
interest rates prior to the 2008–2009 recession. While
Federal Reserve transparency has likely helped reduce
professional forecasters’ errors for the short end of the yield
curve, forecast errors for the long end of the yield curve
have had little reduction.
Correlation of 10-year/3-month spreads with recessions is fine, but not if you can’t predict the inversions. The graph that I provided and was used as a punching bag in this post shows the rapid rise of interest rates preceding nearly all recessions. So, I leave it to you to debate if the rapid rise in funds rates causes the inversions which then correlate to recession occurrences.
In sum, a rise in the funds rate does often preceed curve inversion and recession, but inversion is a more reliable predictor of recession than a rise n the funds rate. Those are obsevable facts, known to business cycle watchers for quite some time.
How much information does the fact that rate hikes preceed inversions and recession give us, beyond what can be gleened from other business-cycle regularities? Forgive the tautology, but that’s where policy error comes in, and policy error isn’t directly observable until after the fact. Things like Taylor rules and the debt burden are useful here. There is more reason to suspect policy error when the funds rate diverges from Taylor rule results of when the debt burden indicates recession risk.
Currently, the curve is inverted, the debt burden indicates elevated recession risk (thank you, Menzie) and coventional Taylor rule settings all wshow the funds rate is higher than neutral:
https://www.atlantafed.org/cqer/research/taylor-rule#Tab1
I have to apologize the adults here for not providing this link. It does seem the time I have to take to counter the non stop lies and incredible stupidity ala Jonny boy takes its toll even on me. Now it is a great discussion so the adults here should read it even though we know lazy little Jonny boy likely will not and even if this moron did – he would never understand it.
https://www.newyorkfed.org/newsevents/speeches/2019/wil190514
When the Facts Change…
May 14, 2019
John C. Williams, President and Chief Executive Officer
R-star Descends
These global shifts in demographics and productivity have two important implications for the future of our economies and for monetary policy. First, slower population and productivity growth translate directly into slower trend economic growth. Second, these trends have contributed to dramatic declines in the longer-term normal or “neutral” real rate of interest, or r-star.
Slower trend growth reduces the demand for investment, while longer life expectancy tends to increase household saving.5 This combination of lower demand for and higher supply of savings, along with other factors, has pushed down r-star. With open capital markets, these global changes in supply and demand affect r-star globally.
The evidence of a sizable decline in r-star across economies is compelling. The weighted average of estimates for five major economic areas—Canada, the euro area, Japan, the United Kingdom, and the United States—has declined to half a percent (Figure 8). That’s 2 percentage points below the average natural rate that prevailed in the two decades before the financial crisis. A striking aspect of these estimates is that they show no signs of moving back to previously normal levels, even though economies have recovered from the crisis. Given the demographic waves and sustained productivity growth slowdown around the world, I see no reason to expect r-star to revert to higher levels in the foreseeable future.
Market Yield on U.S. Treasury Securities at 5-Year Constant Maturity, Quoted on an Investment Basis, Inflation-Indexed
https://fred.stlouisfed.org/series/DFII5
Providing this chart so the adults here might have a discussion of R-star today in light of that John Williams 2019 paper (and when I say adults let me be clear to JohnH – stay the eff out of this discussion as your stupidity is never appreciated).
After the Great Recession monetary policy pushed real interest rates quite low which made sense given that R-star was only 0.5% per Williams. But yes a lot has happened in the last 5 years. We had the Trump insane fiscal stimulus so the FED was right to let real interest rates drift up. And then the pandemic which led the FED to lower real rates for a while. As the economy recovered and inflation temporarily rose, we had a bout of tight money.
Note something however. Real rates in September 2022 were near 2%. And what did we hear from JohhH and his stupid choir of recession trolls? Oh dear the US economy is about to enter a recession. Well that did not occur and now little Jonny boy is telling us we cannot have a recession. Something about the neutral rate? Excuse me but if the neutral rate was below 2% in mid-2022, why would the neutral rate be so much higher today? Little Jonny boy never said as this moron has no clue what the “neutral” rate even is.
But I would love to hear from the adults. Which at the risk of repeating myself does not include little Jonny boy.
This should be an early part of any discussion of the interest rate environment. What, and how much, do we know about r-star? There is a long-term trend in r-star, with short-term variations, depending on current conditions. So the first thing to know is that trend r-star is. Next, how have economic conditions caused the short-term measure to riverge from trend? Here are Holston, Laubach and Williams, confirming what pgl has written, that r-star at the end of 2022 was roughly unchanged from before the pandemic:
https://papers.ssrn.com/sol3/papers.cfm?abstract_id=4482053
Here’s the NY Fed’s page on r-star, including links to the latest estimate:
https://www.newyorkfed.org/newsevents/news/research/2023/20230519
I don’t pretend to understand all of it, but have found this statistic to be fascinating from the time I learned of it/