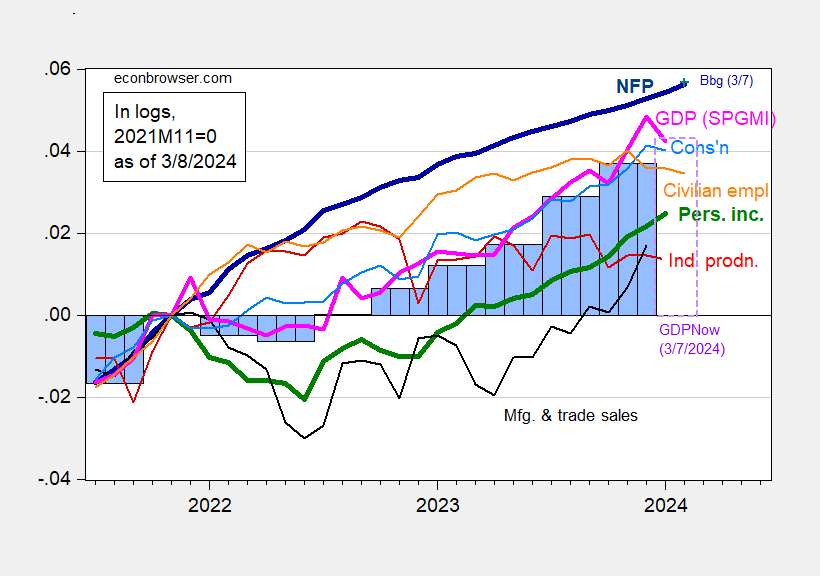
January NFP employment growth surprises on the upside, at +275 vs. +198 thousands consensus. With combined downward revisions in the prior two months totaling 168 thousand, the level of employment is just about consistent with implied consensus. Here’s a picture of key indicators followed by the NBER’s Business Cycle Dating Committee, plus monthly GDP and GDPNow.
Figure 1: Nonfarm Payroll employment incorporating benchmark revision (bold dark blue), implied level using Bloomberg consensus as of 2/1 and December 2023 NFP (blue +), civilian employment (orange), industrial production (red), personal income excluding current transfers in Ch.2017$ (bold green), manufacturing and trade sales in Ch.2017$ (black), consumption in Ch.2017$ (light blue), and monthly GDP in Ch.2017$ (pink), GDP, 3rd release (blue bars), GDPNow for 2024Q1 as of 3/7 (lilac box), all log normalized to 2021M11=0. Source: BLS via FRED, Federal Reserve, BEA 2023Q4 2nd release, S&P Global Market Insights (nee Macroeconomic Advisers, IHS Markit) (3/1/2024 release), and author’s calculations.
While the official NFP series shows continued growth, there is some slower growth evidenced in alternative measures.
Figure 2: Nonfarm payroll employment from February release (bold red), implied level from preliminary benchmark by author and Bloomberg consensus change for February (light red +), Philadelphia Fed early benchmark (light green), household survey series on civilian employment adjusted to NFP concept as reported (pink), and QCEW covered employment for US total (chartreuse), seasonally adjusted using X-13 (in logs). Source: BLS via FRED, BLS, Philadelphia Fed.
The civilian employment series (from the household survey) adjusted to the NFP shows a definite decline (reflecting in part the civilian employment in Figure 1). How much credence to put in this series? I’d say less than that from the CES.
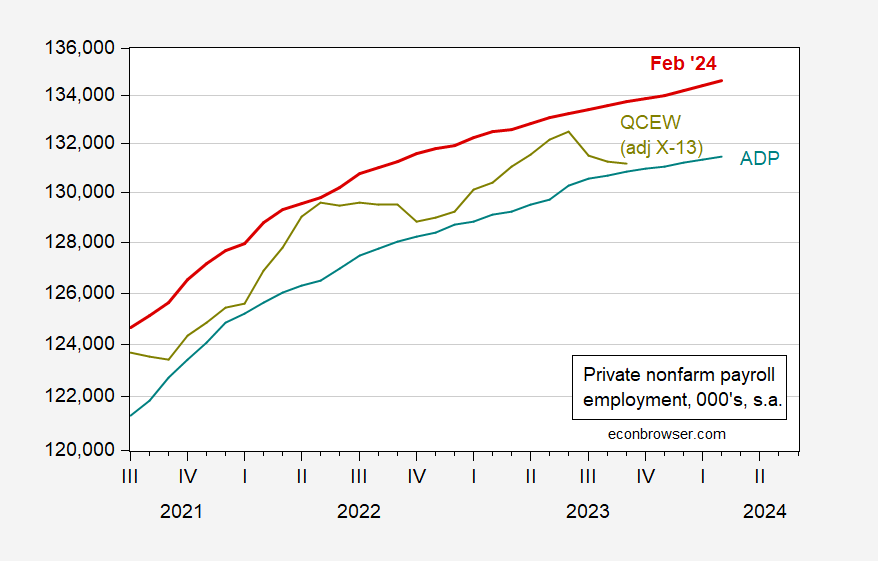
I say this because of the trends in independent series, including the ADP series, and to a lesser extent the QCEW covered employment for private sector.
Figure 3: BLS Private nonfarm payroll employment (red), ADP (teal), and QCEW (chartreuse). Source: BLS, ADP via FRED, BLS, and author’s calculations.
Hard to see the slowdown showing up in the labor market data (putting appropriate weight on CES vs CPS). No recession yet according to the Sahm rule.


There’s a very marked divergence between NFP and alternative measures. I hadn’t brought up Q3 2023 QCEW yet, because it’s not seasonally adjusted. The Philly Fed will apply its seasonal adjustments next Thursday. But even so, there’s no doubt the QCEW was comparatively weak.
Through this past Wednesday, fiscal 2024 tax withholding YoY is only up 1.1%, and that’s without adjusting for inflation, so that has been showing weakness as well.
And this month’s Household Survey is downright recessionary. YoY civilian employment is only up 0.4%. In the past 75 years, that has only occurred 5 times not associated with recessions: 1952, 1995, 2003, 2011, and 2013. U6 underemployment is up 0.5% YoY. In that series’ 30 years, that has only happened once outside of a recession, in 2003. U3 unemployment is up 0.3% YoY. That has occurred outside of recessions 5 times in the past 75 years: in 1952, 1956, 1963, 1967, and 2003 . Finally, while the Sahm rule has not been triggered, that metric is up .27%. That has occurred outside of a recession occurring only 5 times as well: 1962-63, 1967, 1977, 1986, and 2003. In other words, more often than not important Household Survey data at these levels has been associated with a recession.
The current divergence between YoY job growth as measured by the Establishment and Household Surveys is 1.36% Since the Korean War, that big a divergence has occurred 17 times, usually only lasting one month. In other words, I expect the two surveys to track more closely in the months ahead. The question is, which one will resolve towards the other? I suspect the Household Survey’s weakness will be the metric that proves transitory, but for now that weakness is very much real.
Off topic – prices:
The press is covering comme ts from Wal-Mart’s earnings call (I think) about grocery prices. This Yahoo bit is similar to other reports in treating this as an announcement that prices WILL fall. But as Iread the quotes, it sounds like Wal-Mart guys bragging that prices have fallen:
https://www.yahoo.com/lifestyle/walmart-just-announced-major-change-211500651.html
The difference could be a big one. If Wal-Mart starts a price war, the major grocery chains will have to follow. Kroger’s recent merger problem could be a motive for Wal-Mart to cause trouble. Goodie!
If this is just retrospective self-congratulation, nothing changes.
https://fred.stlouisfed.org/series/EMRATIO
The employment to population ratio has been stuck near 60.1% since March 2022. Now if Team Biden can manage to increase this ratio over the new few months, the naysayers will have less to chirp about.
Now if Team Biden can manage to increase real wages at the rate of increased labor productivity, the naysayers would really have less to chirp about.
Isn’t it interesting how much emphasis there is on employment and how little there is on real wages?
Larry Summers: ““When the Fed compares 5% with the 2.5% neutral rate it sees, and people say that monetary policy is substantially restrictive, that’s wrong,” said Summers, a Harvard University professor and paid contributor to Bloomberg TV. “The neutral rate is much higher than that,” he said. “Neutral rates are closer to having a 4-handle than they are to having 2-handle.”” https://finance.yahoo.com/news/summers-says-fed-wrong-neutral-193735874.html
Oh my! What an apoplectic fit this should trigger for pgl and the rest of the low interest rate/high asset price crowd…