In tomorrow’s lecture on the Phillips Curve and the recent inflation surge for Econ 442, I ask whether a modifed Blanchard-Cerutti-Summers (2015) Phillips Curve specification can predict the disinflation. Answer: Yes.
BCS use:
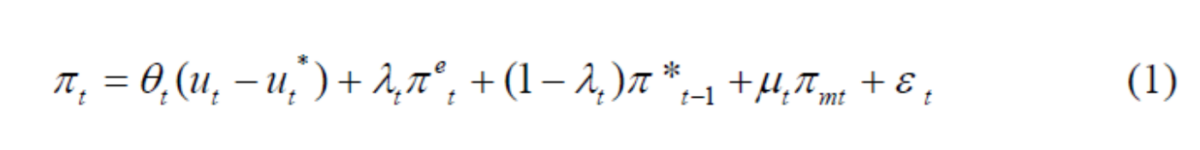
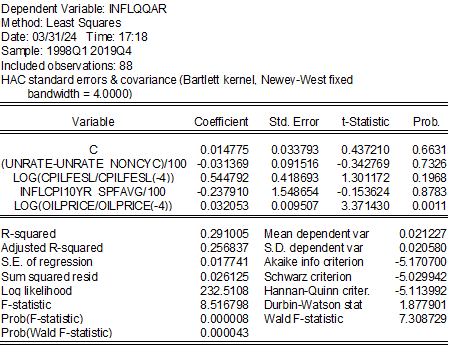
I modify by (1) unconstraining the coefficients on expected and lagged y/y inflation, (2) using lagged y/y core instead of headline CPI, (3) using the relative inflation rate of oil instead of imported materials, and/or (4) adding the NY Fed’s Global Supply Chain Pressure Index (GSCPI). I then estimate 1998-2019 (the sample dictated by availability of the GSCPI, and avoiding the pandemic):

Augmenting with GSCPI.

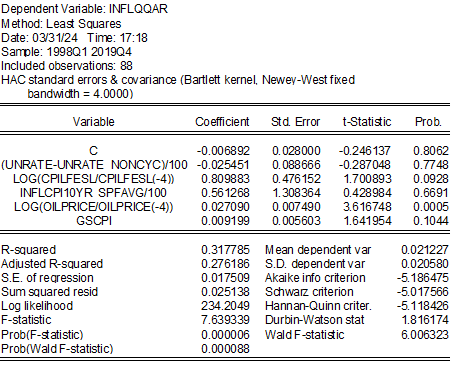
The unemployment gap comes in with the right sign, albeit not statistically significantly so. Oil price inflation is quite significant, as is the GSCPI. Note the impact of the GSCPI comes in a sample that predates the covid pandemic.
Using these two regressions to conduct out of sample predictions, I obtain the following:
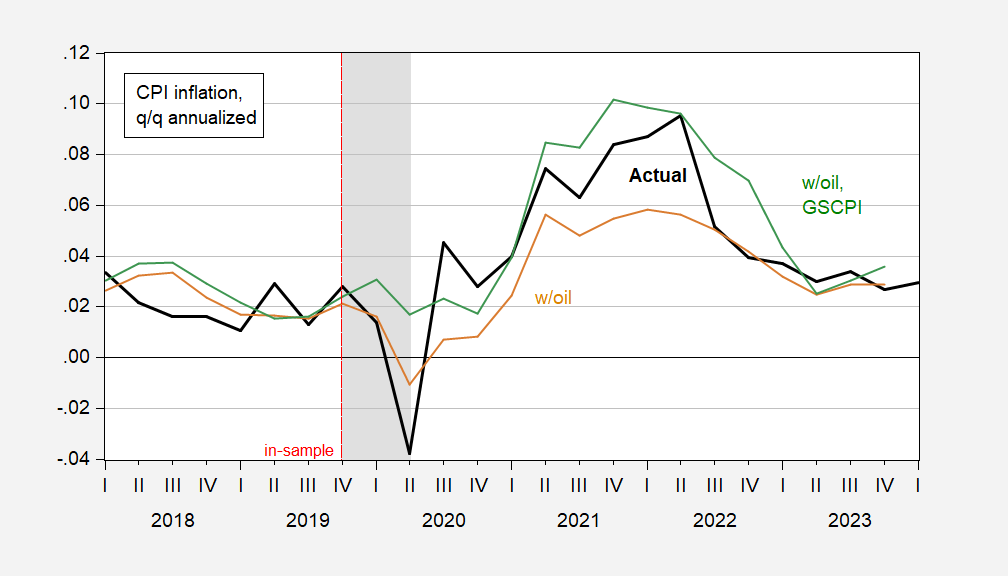
Figure 1: Quarter-on-Quarter CPI inflation annualized (bold black), out-of-sample fit from modified BCS regression (tan), and from modified BCS regression augmented with GSCPI (green). NBER defined peak-to-trough recession dates shaded gray. Source: BLS, NBER, and author’s calculations.
Mean Error (RMSE) for the w/oil specification is 1.3%(1.4%) and for the w/oil, GSCPI is -1.0%(1.2%), with 12 observations 2021Q1-2023Q4.
The fact that the GSCPI-augmented equation predicts the inflation and disinflation better than the oil-alone specification suggests to me that the unexpected (by some) persistence of inflation is due to the unanticipated disruptions in supply chains.
Professor Chinn,
Thank you for posting the EViews model. This will be fun to replicate. Replication forces me to spend time trying to understand what is happening with the model.
Who is this masked man who sits in the front of the class and telling everyone he is in the back of the class??? A photo captured him as he dodged classmates on his trusty white horse “Data Deluge”—-
https://images.app.goo.gl/QUeBETg48tuN24PV6
The GSCPI does a pretty good job in explaining at least some of the mid-2023 disinflation and the stall in that disinflation more recently:
https://www.newyorkfed.org/research/policy/gscpi#/interactive
The GSCPI print for March hasn’t been published yet. As of February, however, the GSCPI reading was just 0.1. Poor maintenance in the container fleet seem likely to boost supply-chain pressures in the near term.
Gasoline going down the last couple days. $2.83 on the last station sign I saw.
It looks like the coefficients are close to the answer book. Not certain why the differences.
C ******************************-0.008736
(UNRATE-NROU)/100************* -0.022978
LOG(CPILFESL/CPILFESL(-4)) ********0.822313
SPF10YR/100 ***********************0.645863
LOG(DCOILWTICO/DCOILWTICO(-4))*** 0.027237
GSCPI **************************0.009223
Something I don’t understand is that using a model to forecast inflation using only “c LOG (DCOILWTICO/DCOILWTICO (-4))” seems to forecast INFLQQAR favorably compared to the more complex model presented. Also, both of the variables on the parsimonious model are very significant. I submit this comment, not as a challenge to those who have superior knowledge, just as a comment requesting clarification. It seems logical that the relationship between UNRATE and NROU should be relevant as well as GSCPI. However, adding just these two variables to the parsimonious model results in a test as redundant variables that are not jointly significant. When the variables from the full model are tested for redundant variables, the test rejects redundancy. Perhaps the answer may be that main significance of the full model is to test the significance of GSCPI in forecasting inflation.
“The fact that the GSCPI-augmented equation predicts the inflation and disinflation better than the oil-alone specification suggests to me that the unexpected (by some) persistence of inflation is due to the unanticipated disruptions in supply chains.” The GSCPI-augmented model however, had more factors than just oil.
Perhaps a stupid question.
There are “more complex models” than AS-AD, and IS-LM~~~Do they have more predictive power?? Just something to ponder.