From Motio Research:
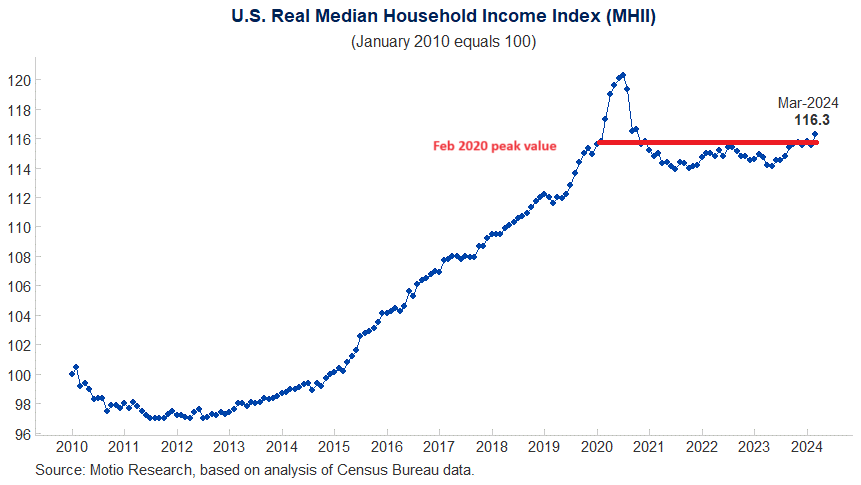
Updated Figure 1: Now includes red line at February 2020 peak value of 115.8 by MDC, which Motio Research suggests be taken as the peak for 2020. Source: Motio Research.
From Motio Research:
Updated Figure 1: Now includes red line at February 2020 peak value of 115.8 by MDC, which Motio Research suggests be taken as the peak for 2020. Source: Motio Research.
Very interesting.
First, you can see the China Depression quite clearly in the data, with real median household income not recovering pre-GFC level until around 2016. Depressions are linked with the rise of fascism, and Trump is elected just at the end of the period.
Similarly, the data shows no material rise in MHI from 2020 until the present, with the numbers showing some upward life now. It ‘s not hard to understand why a significant part of the public was not happy with Bidenomics, but seems more satisfied now.
Finally, I could imagine a sustained rise in median income coming now and lasting for several years.
China Depression? WTF? The title of their graph is “Monthly Series of U.S. Household Income Data”
Which has nothing to do with China – unless you are still peddling your racist trash that COVID 19 was the Kung Flu. Now, now Stevie – such blatant racism is grounds for being banned. And if you were banned – who is going to compete with Bruce Hall for 2024 troll of the year?
Steven Kopits: What is it with you coining terms that are confusing and utterly removed from reality. Are you asserting the slow recovery post-Great Recession was due to China (as opposed to insufficient Federal stimulus and contractionary fiscal policy at the state level)?
Oh, oh! I know this one!
China and only China bought Treasuries and MBS, thereby encouraging mortgage lending. Mortgage lending went blooey! so it’s China’s fault.
Wait. Wasn’t it because the Federal government forced sub-prime lenders to engage in sub-prime lending that sub-prime (and Alt-A and prime) mortgages went blooey, so…it’s all China’s fault?
Gimme time. I’ll figure this out.
I’ve covered the distinctions between recessions, depressions and suppressions before.
A recession is an income statement event. The prescribed monetary policy is lowering interest rates (decreased interest costs) and the monetary transmission mechanism is effective. The typical recession lasts 12-24 months (peak to prior peak). Voters can be counted on change political parties during the downturn. (“It’s the economy, stupid.”) Housing valuations are largely unaffected
A depression is a balance sheet event. The prescribed monetary policy is MMT, although it is not employed. Monetary policy focusing on lowering interest rates is largely ineffective. Interest rates fall effectively to zero and remain there for, say, seven years. Housing values fall, pencil in a drop of 15-20%, and do not respond to zero rates, or with a long lag. Inflation remains muted. Peak to prior peak can be 7-10 years. Voters are prepared to change not only parties, but political systems (eg, rise of fascism).
Suppression is an exogenous event wrt to the economic system.
I say ‘the China Depression’, because 1) it was a depression, in my view, and 2) the cause was China, in two respects. The first of these was a massive oil shock, the result of a peaky oil supply meeting an enormous increase in demand in short time. The second was the impact of China on financial returns, leading to a ‘search for yield’ and prompting developed and otherwise well-governed economies to find themselves taking disproportionate risk, thereby leading to a financial crisis. It is important to note that I do not ‘blame’ China. China is simply a very large economic entity which was integrated at a historically unprecedented rate into the global economy, which naturally led other economies to make large and painful adjustments. I might also note the impact of China on labor markets around the globe.
As for stimulus: In a depression, the policy which would seem most relevant is a direct debasement of the currency, propping up the economy by expropriating creditors. Not nice, but that’s the most direct way to repair the balance sheet. As for oil — and this is the lesson of the 1970s — you cannot stimulate your way out of an oil shock. If supply is reduced, then the real economy must adjust to that reduced supply, regardless of monetary policy.
https://www.princetonpolicy.com/ppa-blog/2022/2/27/recessions-depressions-and-recessions
Lord – that was the dumbest thing I’ve read all year. Depression is a balance sheet event? You are a MORON.
“The prescribed monetary policy is MMT”
Seriously dude – could you turn over your key board to a retarded monkey. It would improve your comments.
according to you methodology, the dot com bust was a recession caused by an income statement problem? I don’t think that is an accurate assessment of the dot com bust. it was more of a balance sheet event. so are you calling the dot com bust a depression Steven? or a recession?
Stevie provided his Feb. 2022 blog post where he also talked about the alleged China depression. Yea – it was incoherent back then but its incoherence difference from his latest incoherence. Unless Stevie’s thesis is that the US housing crisis back in the Bush43 days was caused by trading with China.
Now how those two events are tied – do not ask me. I did not live in Stevie’s warped world of incoherence. BTW – Stevie just said that the 15% devaluation of the yuan was incredible. I guess Stevie is predicting another US housing crisis caused by some “China depression”.
It looks to me like the curve bottoms out in 2012, not late 2016, which would imply that Obama was the one who was elected at the end of the period, before recovery started. When Trump was elected, the index was up to around 108, well above the 97+ when Obama was elected.
But keep it up! I’m backing you for Troll of the Year!
So, there are different ways to view events. You are correct in saying that peak-to-trough is one measure. Peak-to-prior-peak is another measure.
So, let’s consider this example. Imagine that GDP fell by 80% over a year. Now imagine it was followed by two years of great recovery, 10% GDP growth per year. At the end of the second year, GDP would still be 75% below the level of three years ago. Now, how do you think the public would feel? That everyone is fine, or that they are suffering in a deep, deep depression?
If GDP remains below a prior peak, then voters can certainly have nostalgia for ‘the good ol’ days’, and feel that society is not functioning properly. Therefore, while peak to trough certainly has its uses and merits, peak to prior peak is also a legitimate way of looking at events.
Even the Great Recession did not see a 80% fall in real GDP. Are you on crack? Stop posting such stupid comments. DAMN!
“So, let’s consider this example. Imagine that GDP fell by 80% over a year. Now imagine it was followed by two years of great recovery, 10% GDP growth per year. At the end of the second year, GDP would still be 75% below the level of three years ago.”
Let’s see – you actually think 80 – 20 = 75? Damn – you are dumber than I give you credit for. Dude – once you pass preK arithmetic, learn to effing wrote. Economics on the other hand is not something you will ever get.
100, decline by 80% = 20, year 1
20, plus 10% growth year 2, = 22
22, plus 10% growth year 3 = 24.2
At the end of Year 3, GDP would be down by 75.8% compared to baseline. I was being generous.
I think you’re an extraordinarily abusive person. You should seek professional help.
I see. Stevie does arithmetic on the most absurd example ever. OK
Why real median incomes stalled – or worse – between late 2020 and mid-2023 is certainly a valid question. Decomposing the components of this measure helps pinpoint the most important issues.
First, the number of jobs did not recover to February 2020 levels until May 2022. Further, because of population growth, the prime age employment population ratio did not fully recover to pre-pandemic levels until February 2023. Counterbalancing this, real aggregate payrolls for those who were employed matched pre-pandemic levels in July 2021 and have pretty consistently risen since. The waxing and waning effects of inflation due to gas prices and shelter costs obviously also played a role.
But even those do not explain the decline between July 2022 and May 2023, since all of the employment, payrolls, and inflation numbers were moving in the right direction. I suspect the answer would be found in the expiration of some of the pandemic-related economic assistance programs.
In any event, now that all of the employment components have returned to their pre-pandemic levels or better, and the expiration of extra benefits is sufficiently in the rear view mirror, should inflation remain reasonably stable real median household income should continue to increase. And with that, Biden’s approval ratings, as they have recently.
I think we might also be tracking median household size while we’re at it. The stagnation may be overstated.
Btw, to my comment above, Menzie is showing a peak to prior peak analysis on the graph. And we’re saying that Biden’s popularity is improving because we are exceeding the pre-covid peak, a view with which I agree.