Today, we are pleased to present a guest contribution written by Luisa Carpinelli, Filippo Natoli, Kevin Pallara, Luca Rossi, Sergio Santoro and Massimiliano Sfregola; Bank of Italy, DG-Economics, Statistics and Research, Advanced Economies and Macroeconomic Policies Division. The views presented in this column represent those of the authors and do not necessarily reflect those of the Bank of Italy or the ESCB.
| This analysis critically evaluates the forecasting performance of Fed fund futures (FFF) and that of the Federal Reserve’s Summary of Economic Projections (SEP) in the context of predicting Fed Fund rates. Despite FFF being a widely used market-based measure, its reliability has been questioned due to frequent forecasting inaccuracies. In early 2024, a significant divergence between FFF and SEP projections reignited these concerns. FFF quotations reflect both market expectations and a risk premium, which can distort predictions, especially for long-term forecasts. Using the Survey of Primary Dealers (SPD) and by looking at simple model-free measurements of risk premia, this analysis suggests that while FFF can guide current-year forecasts, SPD median forecasts should be preferred for longer horizons. Visual comparisons via “spaghetti charts” indicate that both the Fed and markets often miss out on predicting future policy rates. Relative Mean Absolute Forecast Errors show that the Fed’s forecast errors are, on average, only marginally better than the markets’. However, specific episodes, such as 2019-Q2 and post-SVB collapse in 2023-Q1, reveal that market misjudgments were mainly influenced by risk premia. This analysis offers a robust comparison between the Fed’s and markets’ forecasting abilities, highlighting the necessity of complementing FFF with SPD forecasts to better understand divergences. |
Expectations about the path of Fed Funds rates are monitored and analyzed worldwide, as US monetary policy is a key driver of the macroeconomy, both domestically and in other jurisdictions.[1] Financial markets are an important source of expectations on Fed Funds, also due to their high frequency availability. The most commonly used metric by far are quotations from 30-day Federal Funds Futures (FFF) traded on the Chicago Board of Trade. Those futures are settled based on the monthly average of the daily effective Federal Funds Rate, thereby providing a natural market-based measure of what investors believe the Fed will decide in the following months. A drawback of this indicator is that its out-of-sample forecasting performance is questionable, as many times it fails to predict accurately what the Fed will do.[2]
Doubts on the reliability of FFF resurfaced at the beginning of 2024, when a very large divergence between median policy rates projections reported by the Fed in its Summary of Economic Projections (SEP)[3] and FFF quotations emerged. As of mid-January, FFF were suggesting the Fed would have cut rates by about 150 basis points, twice as much what the Fed itself was reporting a few weeks earlier in the December SEP (see Figure 1).
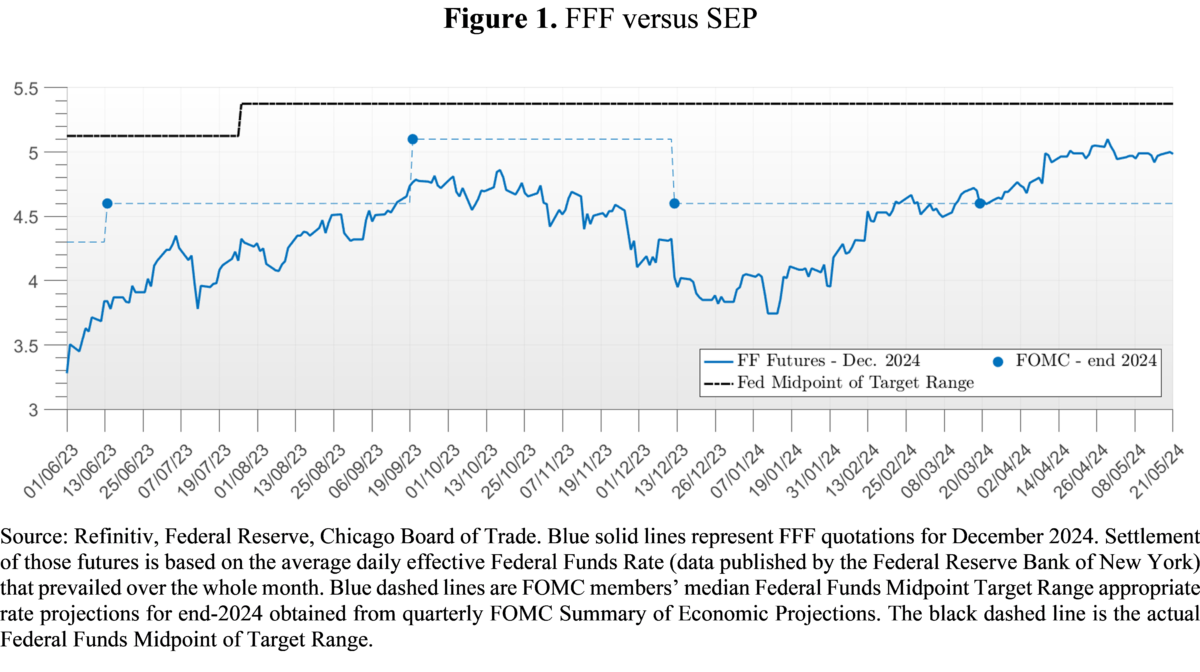
Source: Refinitiv, Federal Reserve, Chicago Board of Trade. Blue solid lines represent FFF quotations for December 2024. Settlement of those futures is based on the average daily effective Federal Funds Rate (data published by the Federal Reserve Bank of New York) that prevailed over the whole month. Blue dashed lines are FOMC members’ median Federal Funds Midpoint Target Range appropriate rate projections for end-2024 obtained from quarterly FOMC Summary of Economic Projections. The black dashed line is the actual Federal Funds Midpoint of Target Range.
Critics of markets’ forecasts surely have a valid point: FFF have many times missed what the Fed would have done by a wide margin. However, before discarding markets’ forecasts, we should look deeper into some related issues. Can we take for granted that FFF are always a valid proxy for market expectations? Has the Fed been good at envisaging the future course of policy rates? More broadly, are markets or rate-setters better at forecasting policy rates?
Before digging in a full-blown horse race, let’s start by tackling the first of the above questions, that is, can FFF always be interpreted as markets’ expectations of the Fed Funds rate? The rationale for the question stems from the fact that FFF quotations, like those of many other derivatives, can be seen as the sum of expectations regarding the underlying variable of interest and a risk premium required by risk-averse investors. To evaluate the possible relevance of the second component we quantify it in a very simple manner, exploiting the Survey of Primary Dealers (SPD) maintained by the New York Fed. The survey is conducted before each FOMC meeting and – among other things – gathers forecasts on the end-year policy rate, GDP growth, the unemployment rate, and inflation just like the SEP, making it a natural option to compare markets’ and Fed’s views around FOMC meetings.[4] We then take the simple difference between FFF quotations on the last day primary dealers can fill in the SPD and median expectations reported by primary dealers to the Fed in the SPD, obtaining model-free measures of the risk premium for current-year, 1-year ahead, and 2-year ahead forecasts (see Figure 2).
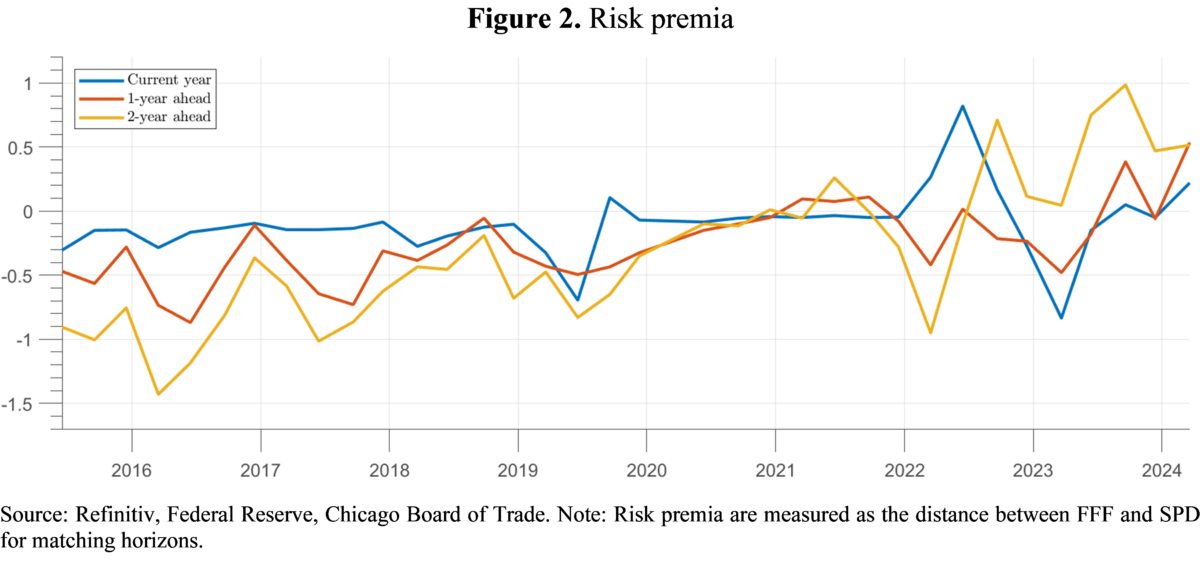
Risk premia are relatively low for current-year forecasts (with some exceptions) whereas they tend to sit at sizeable levels for one- and two-year ahead forecasts. This implies that FFF can provide biased and misleading estimates of market expectations for horizons that many of the above spaghetti charts include. Thus, the rule of thumb we suggest is to complement FFF with SPD median forecasts by relying on the more timely FFF for current-year forecasts, and to instead look at SPD for longer horizons. As will be seen later though, also current-year FFF fluctuations can be dominated by risk premia during particularly turbulent times.
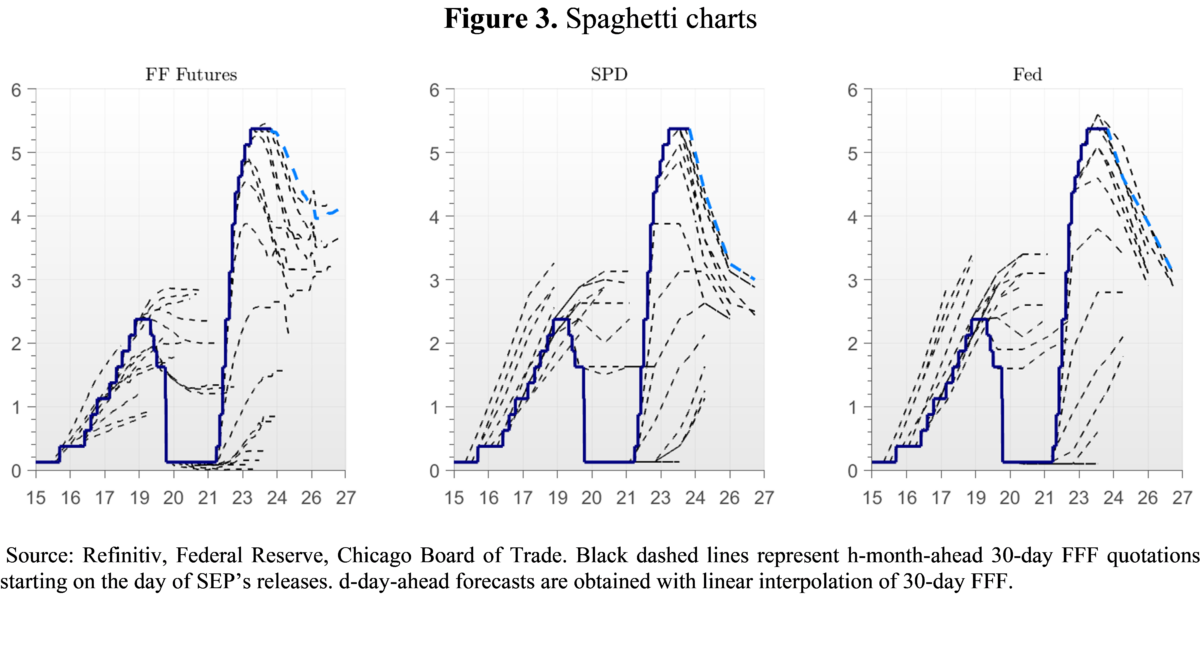
As what regards the first question on the validity of FFF as a proxy for market expectations, we propose the popular “spaghetti charts” reported in the above analyses also for FOMC median projections (see Figure 3). From a quick visual inspection, it is evident that many times the Fed foresees its future decisions also with rather unsatisfactory results. Spaghetti charts however are only a very qualitative first step to gauge the relative performance of Fed versus markets. A more analytical approach is needed.
Let’s now focus on a formal comparison between the average forecast accuracy of markets versus the SEP. As a metric, we look at the Relative Mean Absolute Forecast Errors (MAFE), computed as the Fed’s average MAFE minus markets’ average MAFE; we find that Fed’s forecast errors are on average at most only 3 basis points lower than those of the markets. Thus, the Fed does not consistently outperform markets on average, meaning that FOMC forecasts are unconditionally just as good as those of the markets.
Nevertheless, even if on average there are no meaningful systematic discrepancies, differences emerge in a few episodes. First, in 2019-Q2 FFF quotations for end-year lowered from 2.3% to 1.7%, pricing a 60 basis points rate cut. During 2019 the debate revolved around worries about when one of the largest expansions in US history would have come to an end, with material global risks threatening to put a brake on the US business cycle. Inflation was also recording quite low figures at the time. In spite of markets bets, the FOMC maintained its forecast at 2.4% at the June meeting. During the year however, the Fed indeed decided to lower rates down to 1.6%. At first sight, this thus appears to be one case where markets had a better view of the trajectory of Fed Fund rates.
On the contrary, after Silicon Valley Bank (SVB) collapsed in March 2023, FFF dropped from 5.6% on March 8 to 4.0% in three trading days, but in its March FOMC meeting the Fed maintained its end-2023 forecast at 5.1%. During the rest of the year, the Fed raised rates by 1 p.p. to 5.4%. Judging from FFF alone, this turned out to be a spectacular failure of markets’ assessment.
Nevertheless, in both 2019-Q2 and 2023-Q1 SPD forecasts were very similar to those of the FOMC, thereby implying that in those two specific cases those divergences were mainly due to risk premia. Yet, many analysts attributed the drop in FFF to an equivalent drop in markets’ expectations of policy rates.[5] Therefore, the above examples show that during turbulent times, even within relatively short time periods (less than one year) FFF can also prove to be an unreliable measure of market expectations, and analysts should use SPD instead. In general, we deem wise to compare FFF against pure expectations (not distorted by risk premia) whenever available, to have a rough idea of whether in any given moment FFF can be trusted to begin with.
Our work also leverages information on additional macro variables available in the SEP and in the SPD to shed light on the underlying reasons why the Fed and markets can diverge. For instance, during 2022 markets were repeatedly forecasting a milder cumulated end-2023 tightening than the Fed was trying to convey. We find this was at least due to i) markets forecasting lower inflation and weaker GDP growth, and ii) markets estimating a slightly lower r*. Moreover, we find that a further chunk of the divergence between Fed and markets can sometimes be ascribed to periods of relatively high uncertainty as judged by the central tendency available in the SEP, the interquartile range in the SPD, or Treasury volatility implied by the MOVE.
To conclude, we provide a comprehensive and consistent comparison between Fed’s and markets’ views and forecasting performances, and our framework could be used going forward to assess further divergences. We produce evidence that FFF alone can be a severely biased measure of market expectations, because of the presence of a substantial risk premium at longer horizons or during turbulent periods. We then suggest to complement FFF with SPD forecasts. On average, we find that the Fed is not better than markets in foreseeing its own decisions, but during specific episodes marked differences emerge, which can at least partly be explained by exploiting additional forecasts available both in the SEP and in the SPD.
[1] See, for example, Miranda-Agrippino, Silvia and Hélène Rey (2020) “U.S. Monetary Policy and the Global Financial Cycle,” The Review of Economic Studies, 87 (6), 2754–2776, and Degasperi, Riccardo, Seokki Hong, and Giovanni Ricco (2020) “The global transmission of US monetary policy.” CEPR Discussion Paper No. DP14533.
[2] See, for example, “Investors May Be Getting the Federal Reserve Wrong, Again”, The Economist, January 24th 2024; “Investors are Almost Always Wrong about the Fed”, The Wall Street Journal, February 8th 2024.
[3] SEP are quantitative information collected at quarterly frequency on the expectations on inflation, growth, and unemployment of individual members of the Board of Governors and each Federal Reserve Bank president. They also include expectations on future Federal Funds rate associated with these macroeconomic projections: surveyed members are also asked which path of the Federal Funds rates deem appropriate given their own economic forecasts.
[4] The drawbacks of the SPD are that i) it is available only eight times per year, namely, the same frequency as FOMC meetings; ii) it is published three weeks after the FOMC meeting; iii) the survey is filled around ten days before each FOMC meeting, therefore the information set of Primary Dealers is less complete than that of FOMC members as important macroeconomic releases can be published in that time span. However, the very important advantage is that it provided clean markets’ expectations of the Fed Funds Rate. A caveat to this reasoning is that we implicitly assume expectations of primary dealers to coincide with those of agents investing in FFF; comparing SPD expectations with those in the Survey of Market Participants (SMP) also maintained by the New York Fed we noted that the two are very similar, thereby giving support to our assumption.
[5] See for example “US bank stocks tumble and Treasuries rally amid SVB collapse”, Financial Times, 13th March 2023.
This post written by Luisa Carpinelli, Filippo Natoli, Kevin Pallara, Luca Rossi, Sergio Santoro and Massimiliano Sfregola.
This is very clearly written, and makes good use of how markets function – looking at risk premia. Good job.
One thing:
“…the above examples show that during turbulent times, even within relatively short time periods (less than one year) FFF can also prove to be an unreliable measure of market expectations, and analysts should use SPD instead.”
If one is limited to FFF, SPD and SEP, then this suggestion may make sense, depending on one’s forecast horizon. However, the authors have already pointed toward another option.
Turbulence tends to increase risk premia, resulting in divergences between FFF and the other measures. Can we quantify the increase in risk premia? At worst, an understanding of risk premia in past episodes gives us a crude way of correcting for risk premia in future turbulent times.
Why bother? Because, as the authors note, SPD and SEP data updates infrequently. Waiting around for six weeks to adjust to news won’t do – ya need something market based. FFF plus a risk premium adjustment sounds a lot more like how market participants act than does reverting to SPD in times of turbulence.
Off topic – China and the Philippines:
https://www.rand.org/pubs/commentary/2024/06/how-to-respond-to-chinas-tactics-in-the-south-china.html
Yeah, I know – Rand. Anyhow, a few highlights…
Rand considers China’s grab for Philippine waters a greater risk of war than Taiwan or anything else going on in the region. China has already grabbed about 30% of the Philippines’ maritime economic zone and is pushing for more. Military action is more likely than any other outcome.
Si while the rest of the world wrings its hands over Taiwan, China gobbles up the South China Sea. Coincidence?
The change in the international order which China (and Russia) seem to want is a change from a rules-based order in which the Great Power polices to a power-based order in which the Great Power takes. Good to know.
RAND is establishing “rights to ocean similar to rights to territory….
Could the USN justify a few more CVN?
No. The Law of the Seas establishes those rights:
“Much like internal waters, coastal States have sovereignty and jurisdiction over the territorial sea. These rights extend not only on the surface but also to the seabed and subsoil, as well as vertically to airspace.”
https://sites.tufts.edu/lawofthesea/chapter-two/#:~:text=Much%20like%20internal%20waters%2C%20coastal,well%20as%20vertically%20to%20airspace.
Making stuff up is kinda dishonest. Doing it so badly is just a waste of time.
What did I make up?
The money quote from this RAND author is owning “territory at sea” or such oxymoron.
When did the law of the sea change?
It has always been the “largest gun…… on the biggest ship”.
What is USS Eisenhower up to?
I would ask could you be MORE ST$UPID? Then again you are a proven moron so hey!
Speaking of rates, Krugman was out on Tuesday with a NYT piece:
https://tinyurl.com/yb4865mz
The issue he addresses is this:
:…after a few confusing months early this year, the big narrative from last year — “immaculate disinflation,” inflation gradually ramping down to an acceptable rate even though we haven’t had the recession some economists insisted was necessary — is back on track. The big question now is whether, having discovered that we didn’t need a recession, we’ll get one anyway.”
Krugman offers a couple of versions of the PCE deflator which were running from below 3% to just below 2% in April. He cites those particular versions because each is “a better predictor of future inflation” than more conventional measures, implying that the FOMC is – or should be – looking forward when setting rates.
Delong, commenting on Krugman, writes “…my rough guideline is that monetary policy’s effects on real spending and employment work with a long and variable lag averaging 18 months. Monetary policy became tight in October 2022. 18 months from then is April 2024. We are just now starting to get data from May 2024.”
https://braddelong.substack.com/p/the-case-for-the-proposition-that
Delong, too, is talking about forward-looking policy making. Recently, pgl linked to Mohamed El-Erian claiming that the FOMC is looking backward in embarrassment, not forward; that certainly fits the evidence.
Another possibility is that inflation undershoot is the Fed’s goal, in service of either the FOMC’s reputational concern or its current operating scheme. If the Fed achieves undershoot, history sttongly suggests recession is likely. Certainly “this time is different” in many ways, but can it be that different?
You just can’t help yourself can you?
First, a question about your assertion “It’s not that it’s different, it’s how Covid screwed with pricing.” Doesn’t the second clause utterly contradict the first? Doesn’t “screwed with pricing” amount to “different”? Once again, you’re tendency toward glib statement has tripped you up.
And “this time is different” is more than just pricing. We’ve had supply problems, a massive transfer of income to households and businesses, a termination of that transfer, and the most rapid increase in policy rates on record without much evidence of financial stress by conventional metrics, an inversion of the curve without so far falling into recession. Each of those amounts to “this time is different”.
Kid, this habit of trying to correct people who know more than you do isn’t working out for you.
Learn to write coherently. Or are you campaigning to be chief troll?
“Rejected?” You think I asked you out?
You attempted to contradict me. You were glib, sloppy and wrong, so I corrected you.
It’s “you’re”, not “your”.
And once again, you’ve tried to divert attention from your own errors by pretending to know my emotional state. How many time do plan to use that trick?
Slightly off topic – the fruits of sedition:
The leader of the Republican Party is a seditionist. Unattempted to overturn the results of our political process through violence and connivance. Sedition I not new. Here is what Plutarch says of the first sedition in the Roman Empire:
“This (the assassination of Tiberius) is said to have been the first sedition at Rome, since the abolition of royal power, to end in bloodshed and the death of citizens; the rest (of political disagreements) though neither trifling nor raised for trifling objects, were settled by mutual concessions, the nobles yielding from fear of the multitude, and the people out of respect for the senate.”
So the unpleasant necessity of compromise had been accepted by all, until one day Caligula decided to gain power through sedition. Here is what happened once sedition was first committed:
Caligula Murdered
Claudius Murdered
Nero Sentence to death, committed suicide
Galba Murdered
Otho Suicide
Vitellius Murdered during civil war
Civil war results in the fall of the Augustan Dynasty and the establishment of the Flavian Dynasty. Orderly succession of power resumes.
Just sayin’.
I look at the Catalina affair that Cicero and the senate put down rather than early empirial debauchery. Or 60 odd years earlier the Grachi affair.
While Nero is more “interesting “
Another conflicted jobs report. Payroll employment up big, household employment down bigger, unemployment rate up, wages up.
Here’s a round-up of some of the usual suspects:
The birth/death plug accounts for only 25% of the non-seasonally-adjusted rise in payroll employment in May, after 46% in April.
Non-supervisory and production workers continued to close the wage gap with supervisory workers:
https://fred.stlouisfed.org/graph/?g=1oG6g
The U3 unemployment rate rose despite a decline in the participation rate:
https://fred.stlouisfed.org/graph/?g=1oG8b
The rise in the unemployment rate was due to a 408,000 drop in employment in the household survey, compared to a 272,000 rise in the payroll survey. That 680,000 discrepancy is the second largest since the messy days of late 2020. The birth/death plug doesn’t account for that discrepancy.
The Sahm Rule is steady at 0.37, elevated but not recessionary:
https://fred.stlouisfed.org/series/SAHMREALTIME
Priced-in odds of a Fed rate cut this year have fallen since the data release.
Nice summation. The drop in the employment to population ratio is not good news.
Over at Fox – the Know Nothings were overwhelmed by the rise in the payroll survey. The only other number they noticed was the increase in wages which of course they saw as bad news. Something about INFLATION.
The MAGA crowd prepared for the possibility of another strong payroll jobs gain – which is what we got – by pre-writing a story about how the news is bad for native-born “Murcans”. Gotta give the faux folks something to say.
Before getting into details, keep in mind that all the foreign/native-born data come from the household survey, which shows a weaker picture of the labor market than does the payroll survey, and the payroll survey is generally considered to be more reliable. If we use payroll data, there isn’t much way to say that any group is losing jobs. Note also that foreign/native-born data are not seasonally adjusted, so we may not be getting a very accurate picture due to seasonal variation.
Here we go:
Comparing the level of unemployment among native-born to foreign-born:
https://fred.stlouisfed.org/graph/?g=1oGQl
Foreign-born lost ground in December through February, and are now catching up. Not all that good for the MAGA story.
Comparing the rate of unemployment among native-born to foreign-born:
https://fred.stlouisfed.org/graph/?g=1oGRU
Same picture.
Comparing the level of employment among native-born to foreign-born (note two different scales):
https://fred.stlouisfed.org/graph/?g=1oH2Q
Since November (chosen in an effort to give MAGA types as much help as I can), foreign-born workers have gained 472,000 jobs. In the same period, native-born workers have lost 1.282 million jobs. If the argument is that immigrants are taking jobs from “Murcans”, then at most immigrants account for 37% of native-born job loss, but that involves some pretty sloppy assumptions about causation. Similar sloppy thinking tells us that the 883,000 decline in the native-born labor force “caused” 69% of the decline in native-born employment.
Given inconsistencies in labor market data right now, we ought to be cautious in drawing strong conclusions about even questions of overall hiring strength. We really don’t have data reliable enough to make claims about foreign-born vs native-born winners and losers.
But facts have never stopped the MAGA crowd, so why should a lack of facts?
https://jabberwocking.com/are-illegal-immigrants-stealing-all-our-jobs/
You might appreciate this from Kevin Drum who goes after MAGA types fretting over immigrants allegedly stealing our jobs.
Remember all of Trump’s plans that would be coming in the next two weeks!
https://www.msn.com/en-us/video/health/trump-likes-to-make-this-promise-a-lot-abby-phillip-rolls-the-tape/vi-BB1nMEtl
https://www.bls.gov/news.release/empsit.nr0.htm
THE EMPLOYMENT SITUATION — MAY 2024
Total nonfarm payroll employment increased by 272,000 in May, and the unemployment rate changed little at 4.0 percent, the U.S. Bureau of Labor Statistics reported today.
Nice increase per the payroll survey but the household survey had employment falling by more than 400 thousand. The latter is why the unemployment rate rose EVEN THOUGH the labor force participation rate fell.
Kevin Drum commented on difference over at his place. Maybe Dr. Chinn will offer his insights.
Menzie – I know this is not the place for this comment – but following the May 2024 yesterday – Total nonfarm payroll employment increased by 272,000 in May, and the unemployment rate changed little at 4.0 percent, “Through May 2024, the employment report indicated positive job growth for 41 consecutive months, putting the current streak in 5th place of the longest job streaks in US history.” And the “The 25 to 54 years old participation rate increased in May to 83.6% from 83.5% in April.” https://www.calculatedriskblog.com/2024/06/comments-on-may-employment-report.html Job gains were board based in health care, government, construction, manufacturing, leisure, hospitality. Also the women’s participation in the workforce hit another record high for a second month in a row. In addition – the net worth of households is healthy and growing and rose to $160.8 trillion during the first quarter of 2024. https://www.calculatedriskblog.com/2024/06/feds-flow-of-funds-household-net-worth.html
When does the economic punditry switch to writing articles about how consistently Democratic administrations have broad based economic growth for all compared to the tickle-down disasters of Republican administrations with tax cuts for billionaires and cutting regulations leading to speculative bubbles (housing, crypto-coin)?
Instead – I read articles on Trump out there passing out the same GOP B.S. of tax cuts and cutting regulations and cutting Social Security – but oh gee whiz the tech bros and oil billionaires sure love it – https://www.bloomberg.com/news/articles/2024-06-06/san-francisco-fetes-trump-on-post-conviction-fundraising-tour
“Since the overall participation rate is impacted by both cyclical (recession) and demographic (aging population, younger people staying in school) reasons, here is the employment-population ratio for the key working age group: 25 to 54 years old. The 25 to 54 years old participation rate increased in May to 83.6% from 83.5% in April, and the 25 to 54 employment population ratio was unchanged at 80.8% from 80.8% the previous month. Both are above pre-pandemic levels and near the highest level this millennium.”
Good point. This is why reading Bill McBride’s blog is a must. Thanks for this excellent comment.