Through June:
A comparison of conventional year-on-year vs. instantaneous.
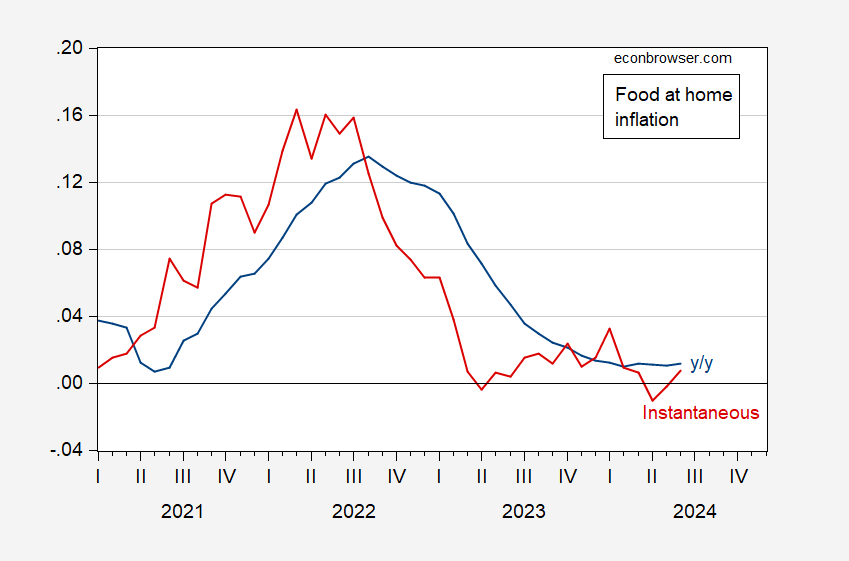
Figure 1: Food at home CPI component, y/y (blue), instantaneous per Eeckhout (2023), T=12, a=4 (red). Source: BLS and author’s calculations.
The Midwest and subregion East North Central (which includes Wisconsin) are showing modest declines q/q.
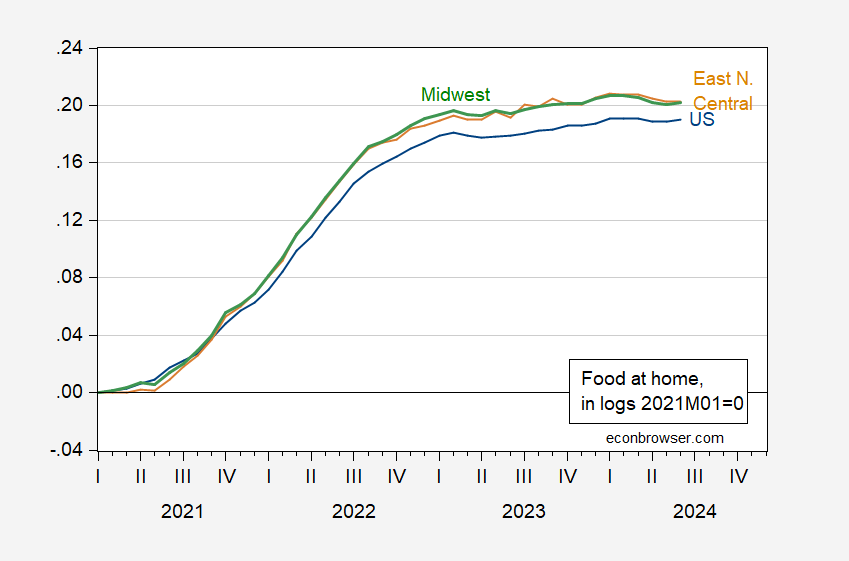
Figure 2: Food at home component of CPI national (blue), Midwest (B/C cities) green, and East North Central (tan), all in logs, 2021M01=0. Midwest and East North Central series seasonally adjusted by author using X-13 log transformed. Source: BLS, and author’s calculations.
FAO Food Price Index firm in June: higher vegetable oil, sugar and dairy prices offset lower cereal quotations
https://www.fao.org/worldfoodsituation/foodpricesindex/en/#:~:text=The%20FAO%20Food%20Price%20Index%20%28FFPI%29%20is%20a,shares%20of%20each%20of%20the%20groups%20over%202014-2016.
The FAO Food Price Index (FFPI) is a measure of the monthly change in international prices of a basket of food commodities.
An important issue indeed but also different from the index Dr. Chinn highlighted.
Food price Inflation in Europe, y/y:
https://tradingeconomics.com/european-union/food-inflation
In the U.S.:
https://tradingeconomics.com/united-states/foodInflation.
In May, Europe 1.6%, U.S. 2.1%. Currency strength hasn’t worked out for the U.S. when it comes to food price inflation.
“Currency strength hasn’t worked out for the U.S. when it comes to food price inflation.”
How much food is produced locally for local consumption. I’m not saying food is a nontradeable good but I haven’t seen a good analysis of the role of exchange rate movements and the impact on a wide basket of consumed food either, I’m also thinking about how domestic farmers insist on protection from foreign competition. I wonder if our host knows of any relevant literature,