Preliminary NFP count is down 6.5K (on 3 million), unemployment rate up 0.1 ppts.
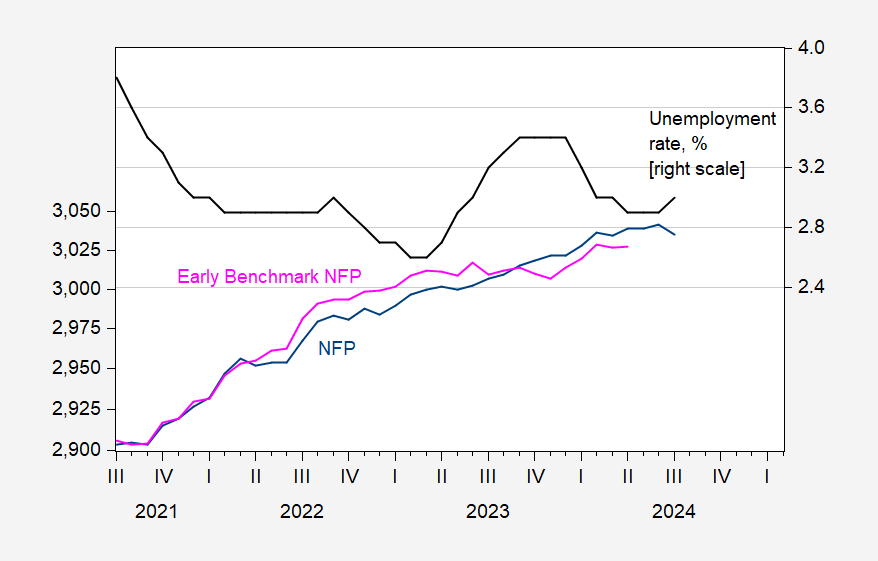
Figure 1: Nonfarm payroll employment (blue, left scale), early benchmark (pink, left scale), both in 000’s, s.a., and unemployment rate, % (black, right scale). Source: BLS, DWD, and Philadelphia Fed.
The drop in NFP is about 1.5 standard deviations from mean growth over this period. This slowdown in employment growth is on display across many states (Wells Fargo).
How does these figures fit into the overall economic picture for Wisconsin? I show NFP and civilian employment in Figure 2 below.
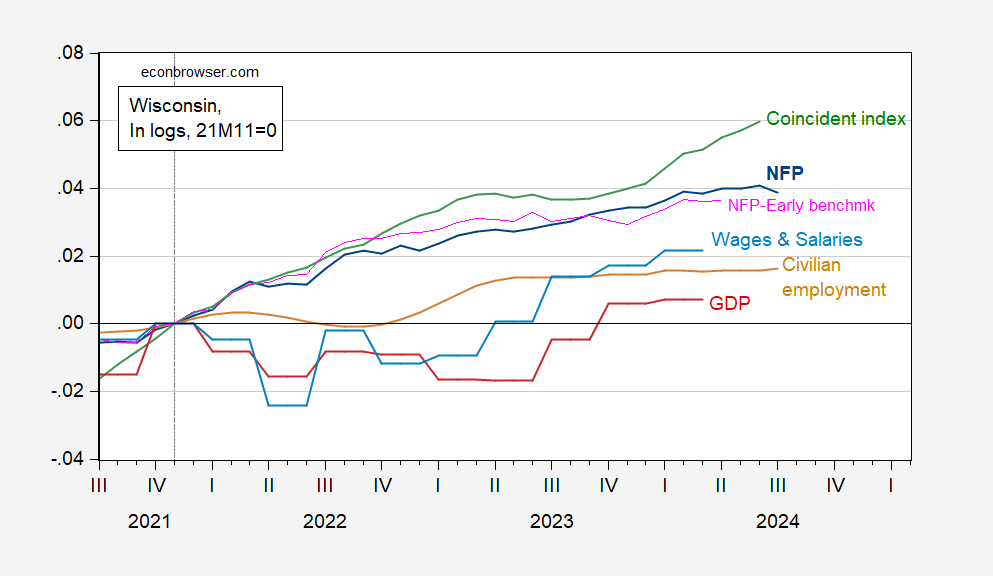
Figure 2: Wisconsin Nonfarm Payroll Employment (dark blue), Philadelphia Fed early benchmark measure of NFP (pink), Civilian Employment (tan), real wages and salaries deflated by national chained CPI (sky blue), GDP (red), coincident index (green), all in logs 2021M11=0. Source: BLS, BEA, Philadelphia Fed [1], [2], and author’s calculations.