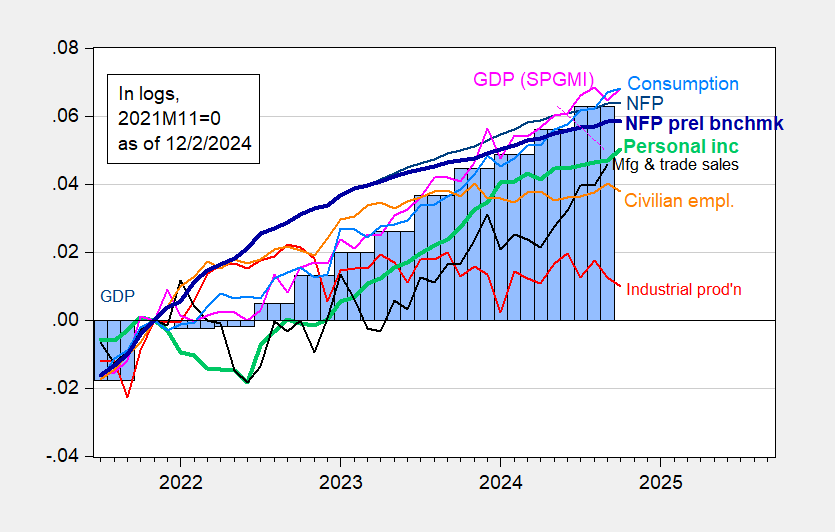
Here are key indicators followed by the NBER’s Business Cycle Dating Committee (top indicators employment and person income) plus monthly GDP from S&P (nee Macroeconomic Advisers nee IHS Markit):
Figure 1: Nonfarm Payroll (NFP) employment from CES (blue), implied NFP from preliminary benchmark (bold blue), civilian employment (orange), industrial production (red), personal income excluding current transfers in Ch.2017$ (bold light green), manufacturing and trade sales in Ch.2017$ (black), consumption in Ch.2017$ (light blue), and monthly GDP in Ch.2017$ (pink), GDP (blue bars), all log normalized to 2021M11=0. Source: BLS via FRED, Federal Reserve, BEA 2024Q3 2nd release, S&P Global Market Insights (nee Macroeconomic Advisers, IHS Markit) (12/2/2024 release), and author’s calculations.
From S&P Global Market Insights:
Monthly GDP rose 0.3% in October, largely reversing a 0.4% decline in September that was revised from a previously reported 0.3% decline. The increase in monthly GDP in October was accounted for by a large increase in net exports. Final sales to domestic purchasers posted a small decline, while nonfarm inventory investment posted a small increase.
S&PGMI and Goldman Sachs tracking as of yesterday were 1.6% and 2.4%, respectively, for Q4, while GDPNow was 3.2%. NY Fed and St Louis Fed were at 1.9% and 1.31%, respectively, as of 11/29.
Addendum, 11:41 PT:
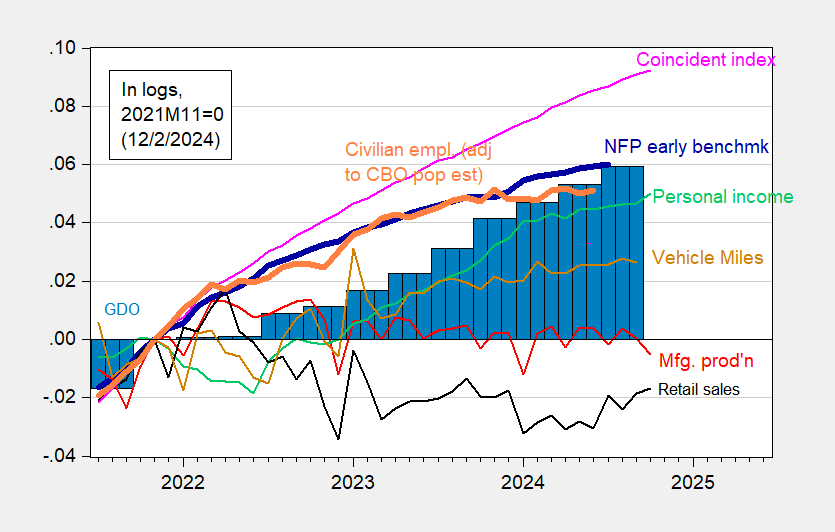
Here are alternative indicators:
Figure 2: Nonfarm Payroll early benchmark (NFP) (bold blue), civilian employment adjusted using CBO immigration estimates through mid-2024 (orange), manufacturing production (red), personal income excluding current transfers in Ch.2017$ (light green), retail sales in 1999M12$ (black), vehicle miles traveled (chartreuse), and coincident index (pink), GDO (blue bars), all log normalized to 2021M11=0. Early benchmark is official NFP adjusted by ratio of early benchmark sum-of-states to CES sum of states. Source: Philadelphia Fed, Federal Reserve via FRED, BEA 2024Q3 2nd release, and author’s calculations.


widespread received wisdom on last month’s tiny 12,000 increase in non-farm payrolls was that it was impacted by Hurricane Helene, which made landfall on September 26 and devastated businesses in 7 US states, and Hurricane Milton, which crossed Florida on October 9th while the employment surveys were being conducted…however, this morning’s JOLTS report shows that 1,633,000 were either laid off, fired or otherwise discharged in October, down by 169,000 from the revised 1,802,000 who were discharged in September, thus showing no sign of job losses due to the hurricanes…
so what happened to October payrolls? part of it was because 3,326,000 of us voluntarily quit our jobs in October, up by 228,000 from the 3,098,000 who quit their jobs in September, while the quits rate, widely watched as an indicator of worker confidence, rose to 2.1% of total employment from 1.9% in September…the rest was because new hires totaled 5,313,000, down by 269,000 from the revised 5,582,000 who were hired or rehired in September…
go figure..