Analysis of current economic conditions and policy
Reinversion Continues
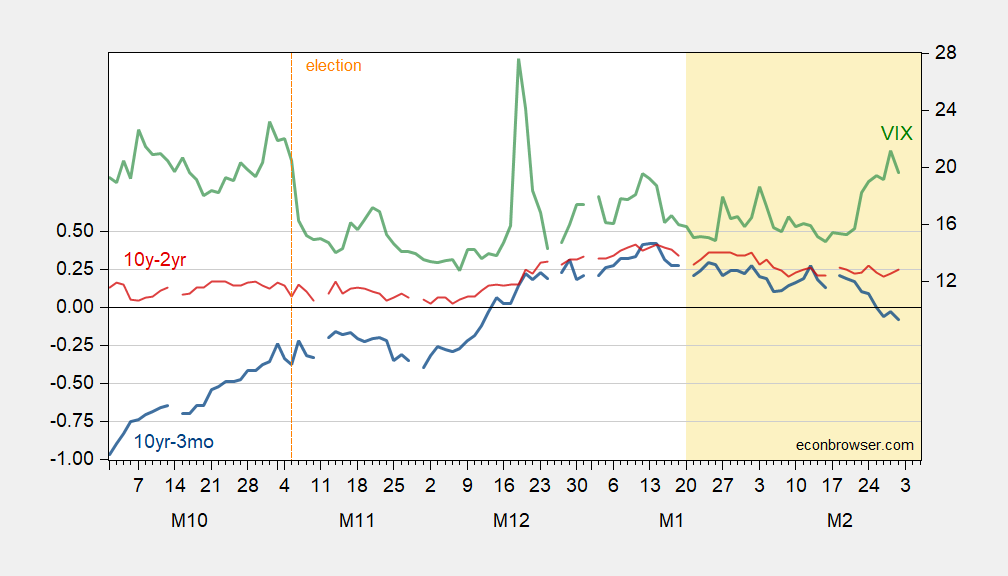
End of week spreads:
Figure 1: 10yr-3mo Treasury spread (blue, left scale), 10yr-2yr Treasury spread (red, left scale), both in %; VIX at close (green, right scale). Source: Treasury, CBOE via FRED.
19 thoughts on “Reinversion Continues”
Fredrick Pauper
Business expansion has eroded creating a flight to safety, even if wrong headed.
baffling
why would you consider it wrong headed? uncertainty seems to be increasing quite significantly. many people believe the stock market is overvalued. if you believe interest rates will drop (not in the inflation camp), then buying treasuries while rates are high with an expectation that they will drop in the future seems to be the correct move. so why is a flight to safety wrong headed? should you buy into overvalued stocks right now?
Macroduck
Household spending is the largest demand category in GDP. Household demand doesn’t have to fall in order for GDP (employment, income, industrial output) to fall. A slowing in Household spending can be enough to induce recession.
It’s not new for the spending of the top income quintile to expand faster than overall spending – this is the U.S., after all – but we’re hearing more about it now. Here’s the picture of spending by income quintile through 2023:
The data for 2024 won’t be released until December (assuming the U.S. still releases data in December).
We’re also hearing that equity values are driving spending in the top quintile – the wealth effect, don’t you know. Historically, housing wealth seems to have a larger impact on spending than financial wealth, but with mortgage equity withdrawal limited right now, that may be less true these days.
Anyhow, spending by the top quintile is a big deal for the economy, and the stock market may be a big deal for top-quintile spending.
So what’s the outlook for stocks? I don’t know nothin’ ’bout no stocks, but here’s the S&P500 12-month trailing P/E history:
The Shiller ratio is a bit more extreme than the standard 12-month trailing P/E. The Shiller ratio, with its ten-year tail, still reflects the loss of earnings from the Covid recession. Y’all decide for yourselves whether that’s a problem.
Either way, equities are expensive relative to earnings. As the picture shows, extreme P/Es tend not to last long; they are followed by stock market declines.
The stock market is not the economy, and it is certainly not a forecast of the economy. However, there is some risk to household spending from an overvalued stock market.
Macroduck
Here’s Bloomberg on spending by the top earners, with more recent data, by decile:
Anyhow, same basic message: “If the extreme spending habits of a small group of people are what’s keeping a large portion of the economy churning, then that group of people also has an outsize ability to bring everyone else down with them.”
BBG rounds up Mark Zandi to make the same point about the wealth effect: “The market feels, at best, at the high side of fair value, probably more likely overvalued, bordering on frothy.” The Nasdaq hasn’t made a new high since December, and is down 2.25% so far this year.
numbers
Smoothed P/E ratios are at the levels of 1998 and 2021 (the latter could be justified by the very low interest rates at the time, the former not so much).
Additionally, dividend yields (1.24%) are approaching the all-time lows of 1999-2000 (1.11%), the only other time in history it’s ever been that low. We’d need a 20% haircut on S&P prices to come back to recent normals of dividend yield and P/E ratios.
On the other hand, earnings and dividends could continue to increase at the amazing 6% inflation-adjusted annual rate they have been for the last 10 years, the hope of which is the only thing keeping this rally going.
Not Trampis
inversion is only of interest if it is caused by central bank tightening
Fredrick Pauper
I don’t think central banks matter much when they are around market prices. The 2001 recession was a real corporate profit driven recession. Manufacturing began mass layoffs after the 4th break in 2000 and was a hidden reason for Al Gore disappointing performance as he eschewed his southern base for Rust belt voters……who were becoming disgruntled. This error had ramifications still being felt today. Nothing central banks do was going to change that. Real corporate profit crashed in late 99 and the party was over. Lower rates meant and did nothing.
Macroduck
Then it’s of interest now. The Fed tightened.
In fact, since the Great Moderation, the Fed has eased prior to the official onset of every recession, and the Fed has eased now. I think we can afford to be a little interested.
Our tools for forecasting recession are not all that reliable. To declare that you have some special rule to tell when one of those tools is or is not of interest assumes more knowledge than we have.
Ivan
That was a joke, right?
James
I once thought that 170 million hard working Americans could power the U.S. economy through another incompetent and corrupt Republican administration and we would have slowing GDP and higher prices (i.e. stagflation) – now after watching these local GOP reps continue to repeat their – B.S. talking points – that there is fraud somewhere (remember Reagan’s welfare queens) and they insist on giving tax cuts to oligarchs – I’m thinking we have to once again go through another GOP recession.
Ivan
I hope you are right that is will just be another GOP setback that can be corrected when democrats take over again. But this time some of the damage may be irreversible. I have come to think about the conversion of the superpower USSR to a backwater of authoritarian kleptocracy, with a population ignorant enough to give Putin a 60%+ approval rating.
Macroduck
Off topic – Krugman is cribbing off my homework again. A while back, I linked to this article from the WSJ:
Older, whiter, less educated regions elected the felon-in-chief says the Journal in 2017. And it happened again in 2024. Now, Krugman says the same thing is happening in other parts of the world:
He refers to them as “left behind regions”, where the young, particularly young women, have left for better opportunities, leaving older populations and incels to deal with declining communities. Reactionary politicians take advantage by appealing to the good old days, when the left-behinds were on top.
Some part of the decline in marriage and birth rates may result from this sorting by sex. That’s for another time, though it does fit into reactionary rhetoric. No wonder Elon’s mini-me associates admire him – look at all those kids.
Ivan
Not paying attention to the “left behind” group has been a costly tactical error. The GOP has fooled them into thinking that GOP can turn time back to “the good old days”, even as they know that will be impossible. Then they blame democrats for the fact that what they promised was not possible. The democrats take the bait and fight against the reactionary agenda making themselves the “enemy’ of these “left behinds”. Democrats need to develop new win-win narratives that offer participation of everybody in the future.
Macroduck
Good thing Israel would never engage in genocide, what with the Jewish experience and all:
The latest sycophant is Commerce Secretary Howard Lutnick. On Friday Musk said that GDP should exclude government spending so today Lutnick says he agrees. Note that Lutnick is responsible for both GDP and PCE reports. It looks like gaming the data is off to the races.
Lutnick operated a primary dealer of US Treasuries for the Fed. You would think he would know better, but running a business is not the same as running a government. Instead we get a government of idiots.
joseph
Here is Lutnick’s justification for excluding government spending from GDP:
“If the government buys a tank, that’s GDP,” Lutnick said Sunday. “But paying 1,000 people to think about buying a tank is not GDP. That is wasted inefficiency, wasted money. And cutting that, while it shows in GDP, we’re going to get rid of that.”
This is funny coming from the CEO of Cantor Fitzgerald which has thousands of employees who sit around all day in front of computer monitors pushing buttons to shift fake electronic money back and forth from here to there. How many tanks do they build?
Macroduck
GDPNow posted an update in response to ISM and construction spending, taking its GDP estimate to -2.8% (SAAR) for Q1, from -1.5%. Personal consumption spending is called flat for the quarter:
Just to repeat, January PCE weakness was very likely overstated due to weather and related seasonal adjustment. There are plenty of strains on households, but household spending tends to adjust smoothly, rather than all at once.
There is precedent for a big sungle-month drop in real PCE being followed by an immediate recovery. In December, 2018, there was a 0.8% drop in real PCE, with no weakness after that, and no recession. In February, 2021, a 1.0% drop in real PCE was followed by a 4.3% rise in March – no recession. January’s 0.5% drop is the largest since February, 2021.
All that said, the last time real PCE fell on a quarterly basis without an associated recession was in the early 1950s.
Ivan
The one argument for a huge drop in consumption with a very slow recovery, is the idea that suddenly a large number of families, with federal employment, are uncertain as to whether they will lose an income with little or no warning. Add to that any family who has income from employment in any enterprise that has an export component to it. Now you are talking serious numbers of households that overnight went from happy spenders, to cautious consumers.
Macroduck
The LA Times offers a clear description of the realities of culling flocks as a means of combatting bird flu:
The upshot is that culling is the most practical solution to infection in a given flock. The mortality rate is nearly 100%. The infection is highly contagious, so once the flock is infected, most birds are likely to die. Inspecting birds for infection is sufficiently expensive that, at least at today’s (record nominal) price, inspection is not cost effective. As a result, culling will continue even if other efforts to prevent infection are successful.
I don’t know whether this flu is likely to become endemic, but it seems reasonable to plan based on the assumption that it is. If so, then vaccination is likely to become standard practice. Feeding soiled nesting material to cattle should probably stop. The cost of preventative measures could be permanent, so we should plan accordingly.
Business expansion has eroded creating a flight to safety, even if wrong headed.
why would you consider it wrong headed? uncertainty seems to be increasing quite significantly. many people believe the stock market is overvalued. if you believe interest rates will drop (not in the inflation camp), then buying treasuries while rates are high with an expectation that they will drop in the future seems to be the correct move. so why is a flight to safety wrong headed? should you buy into overvalued stocks right now?
Household spending is the largest demand category in GDP. Household demand doesn’t have to fall in order for GDP (employment, income, industrial output) to fall. A slowing in Household spending can be enough to induce recession.
It’s not new for the spending of the top income quintile to expand faster than overall spending – this is the U.S., after all – but we’re hearing more about it now. Here’s the picture of spending by income quintile through 2023:
https://fred.stlouisfed.org/graph/?g=1E5FL
The data for 2024 won’t be released until December (assuming the U.S. still releases data in December).
We’re also hearing that equity values are driving spending in the top quintile – the wealth effect, don’t you know. Historically, housing wealth seems to have a larger impact on spending than financial wealth, but with mortgage equity withdrawal limited right now, that may be less true these days.
Anyhow, spending by the top quintile is a big deal for the economy, and the stock market may be a big deal for top-quintile spending.
So what’s the outlook for stocks? I don’t know nothin’ ’bout no stocks, but here’s the S&P500 12-month trailing P/E history:
https://www.macrotrends.net/2577/sp-500-pe-ratio-price-to-earnings-chart
Here’s the Shiller P/E ratio:
https://www.multpl.com/shiller-pe
The Shiller ratio is a bit more extreme than the standard 12-month trailing P/E. The Shiller ratio, with its ten-year tail, still reflects the loss of earnings from the Covid recession. Y’all decide for yourselves whether that’s a problem.
Either way, equities are expensive relative to earnings. As the picture shows, extreme P/Es tend not to last long; they are followed by stock market declines.
The stock market is not the economy, and it is certainly not a forecast of the economy. However, there is some risk to household spending from an overvalued stock market.
Here’s Bloomberg on spending by the top earners, with more recent data, by decile:
https://archive.ph/7CA3p
I gotta get better data.
Anyhow, same basic message: “If the extreme spending habits of a small group of people are what’s keeping a large portion of the economy churning, then that group of people also has an outsize ability to bring everyone else down with them.”
BBG rounds up Mark Zandi to make the same point about the wealth effect: “The market feels, at best, at the high side of fair value, probably more likely overvalued, bordering on frothy.” The Nasdaq hasn’t made a new high since December, and is down 2.25% so far this year.
Smoothed P/E ratios are at the levels of 1998 and 2021 (the latter could be justified by the very low interest rates at the time, the former not so much).
Additionally, dividend yields (1.24%) are approaching the all-time lows of 1999-2000 (1.11%), the only other time in history it’s ever been that low. We’d need a 20% haircut on S&P prices to come back to recent normals of dividend yield and P/E ratios.
On the other hand, earnings and dividends could continue to increase at the amazing 6% inflation-adjusted annual rate they have been for the last 10 years, the hope of which is the only thing keeping this rally going.
inversion is only of interest if it is caused by central bank tightening
I don’t think central banks matter much when they are around market prices. The 2001 recession was a real corporate profit driven recession. Manufacturing began mass layoffs after the 4th break in 2000 and was a hidden reason for Al Gore disappointing performance as he eschewed his southern base for Rust belt voters……who were becoming disgruntled. This error had ramifications still being felt today. Nothing central banks do was going to change that. Real corporate profit crashed in late 99 and the party was over. Lower rates meant and did nothing.
Then it’s of interest now. The Fed tightened.
In fact, since the Great Moderation, the Fed has eased prior to the official onset of every recession, and the Fed has eased now. I think we can afford to be a little interested.
Our tools for forecasting recession are not all that reliable. To declare that you have some special rule to tell when one of those tools is or is not of interest assumes more knowledge than we have.
That was a joke, right?
I once thought that 170 million hard working Americans could power the U.S. economy through another incompetent and corrupt Republican administration and we would have slowing GDP and higher prices (i.e. stagflation) – now after watching these local GOP reps continue to repeat their – B.S. talking points – that there is fraud somewhere (remember Reagan’s welfare queens) and they insist on giving tax cuts to oligarchs – I’m thinking we have to once again go through another GOP recession.
I hope you are right that is will just be another GOP setback that can be corrected when democrats take over again. But this time some of the damage may be irreversible. I have come to think about the conversion of the superpower USSR to a backwater of authoritarian kleptocracy, with a population ignorant enough to give Putin a 60%+ approval rating.
Off topic – Krugman is cribbing off my homework again. A while back, I linked to this article from the WSJ:
https://graphics.wsj.com/china-exposure/?utm_source=npr_newsletter&utm_medium=email&utm_content=20250208&utm_term=9975524&utm_campaign=money&utm_id=26789034&orgid=&utm_att1=
Older, whiter, less educated regions elected the felon-in-chief says the Journal in 2017. And it happened again in 2024. Now, Krugman says the same thing is happening in other parts of the world:
https://paulkrugman.substack.com/p/the-economics-of-left-behind-regions
He refers to them as “left behind regions”, where the young, particularly young women, have left for better opportunities, leaving older populations and incels to deal with declining communities. Reactionary politicians take advantage by appealing to the good old days, when the left-behinds were on top.
Some part of the decline in marriage and birth rates may result from this sorting by sex. That’s for another time, though it does fit into reactionary rhetoric. No wonder Elon’s mini-me associates admire him – look at all those kids.
Not paying attention to the “left behind” group has been a costly tactical error. The GOP has fooled them into thinking that GOP can turn time back to “the good old days”, even as they know that will be impossible. Then they blame democrats for the fact that what they promised was not possible. The democrats take the bait and fight against the reactionary agenda making themselves the “enemy’ of these “left behinds”. Democrats need to develop new win-win narratives that offer participation of everybody in the future.
Good thing Israel would never engage in genocide, what with the Jewish experience and all:
https://apnews.com/article/israel-palestinians-hamas-war-news-ceasefire-hostages-03-02-2025-99402570996dcf33239d0492d99909e4
Cutting off food to 2 million people, yet again, isn’t genocidal. Not at all.
Well, Elon Musk says “Jump” and everyone dutifully says “How high?”
The latest sycophant is Commerce Secretary Howard Lutnick. On Friday Musk said that GDP should exclude government spending so today Lutnick says he agrees. Note that Lutnick is responsible for both GDP and PCE reports. It looks like gaming the data is off to the races.
Lutnick operated a primary dealer of US Treasuries for the Fed. You would think he would know better, but running a business is not the same as running a government. Instead we get a government of idiots.
Here is Lutnick’s justification for excluding government spending from GDP:
“If the government buys a tank, that’s GDP,” Lutnick said Sunday. “But paying 1,000 people to think about buying a tank is not GDP. That is wasted inefficiency, wasted money. And cutting that, while it shows in GDP, we’re going to get rid of that.”
This is funny coming from the CEO of Cantor Fitzgerald which has thousands of employees who sit around all day in front of computer monitors pushing buttons to shift fake electronic money back and forth from here to there. How many tanks do they build?
GDPNow posted an update in response to ISM and construction spending, taking its GDP estimate to -2.8% (SAAR) for Q1, from -1.5%. Personal consumption spending is called flat for the quarter:
https://www.atlantafed.org/cqer/research/gdpnow
Just to repeat, January PCE weakness was very likely overstated due to weather and related seasonal adjustment. There are plenty of strains on households, but household spending tends to adjust smoothly, rather than all at once.
There is precedent for a big sungle-month drop in real PCE being followed by an immediate recovery. In December, 2018, there was a 0.8% drop in real PCE, with no weakness after that, and no recession. In February, 2021, a 1.0% drop in real PCE was followed by a 4.3% rise in March – no recession. January’s 0.5% drop is the largest since February, 2021.
All that said, the last time real PCE fell on a quarterly basis without an associated recession was in the early 1950s.
The one argument for a huge drop in consumption with a very slow recovery, is the idea that suddenly a large number of families, with federal employment, are uncertain as to whether they will lose an income with little or no warning. Add to that any family who has income from employment in any enterprise that has an export component to it. Now you are talking serious numbers of households that overnight went from happy spenders, to cautious consumers.
The LA Times offers a clear description of the realities of culling flocks as a means of combatting bird flu:
https://www.latimes.com/environment/story/2025-02-26/poultry-culling-hasnt-stopped-h5n1-bird-flu
The upshot is that culling is the most practical solution to infection in a given flock. The mortality rate is nearly 100%. The infection is highly contagious, so once the flock is infected, most birds are likely to die. Inspecting birds for infection is sufficiently expensive that, at least at today’s (record nominal) price, inspection is not cost effective. As a result, culling will continue even if other efforts to prevent infection are successful.
I don’t know whether this flu is likely to become endemic, but it seems reasonable to plan based on the assumption that it is. If so, then vaccination is likely to become standard practice. Feeding soiled nesting material to cattle should probably stop. The cost of preventative measures could be permanent, so we should plan accordingly.