I was pondering whether the US is a large country insofar as tariffs on avocados are concerned. Since 90% of consumption is from Mexico, one might think the US is a large country; on the other hand, elasticities matter. This study by Ambrozek et al. (2019) indicates 0.2 demand elasticity at shipper level. Let’s guess that supply elasticity is 0.2 (about 80% of Mexican exports go to the US, and about 85% of production is exported; Carman and Kraft (1998) cite 0.2.
This implies about a 50%-50% split of the tariff, counterfactual February price equal to December, and no exchange rate offset.
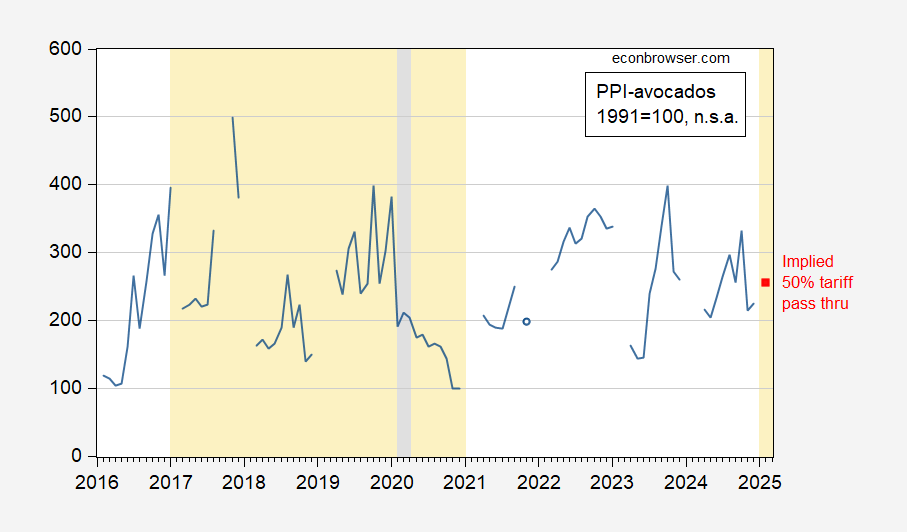
Figure 1: PPI avocado n.s.a., 1991=100 (blue), implied price (red square). NBER defined peak-to-trough recession dates shaded gray. Trump administrations shaded orange. Assume counterfactual February price is same as actual December price, and no exchange rate reaction. Source: BLS via FRED, NBER, author’s calculations.
I’ve assume little exchange rate reaction, as the Mexican peso has not moved much even in the face of tariff threats. If there is a Mexican depreciation in response (it could come from dollar appreciation against all currencies as uncertainty rises), then the after-tax avocado price could rise less.
Interesting timing as avocado consumption picks up in February, when about 5% of annual consumption takes place during the Superbowl.
The keto crowd is going to have to do some belt tightening.
I’ll be here all week.