Including “Liberation Day” and “termination”, down 15%, and 7.9% (log terms) relative to post-inauguration peaks (through 4/22 close).
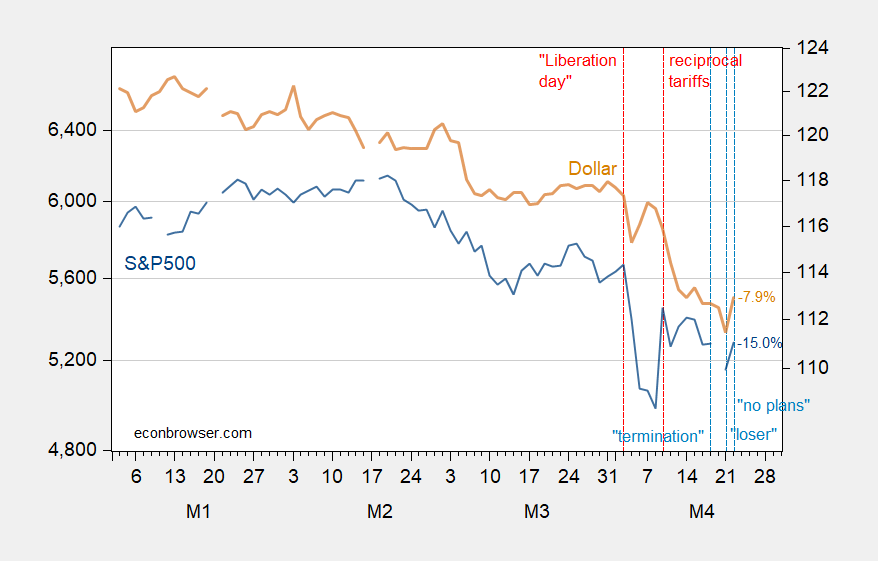
Figure 1: S&P500 (blue, left log scale), and nominal dollar against advanced country currencies (tan, right log scale). Last two days of dollar use dxy spliced to Fed measure. Source: FRED.
If the tariff issue is going to become less distracting, then something else will have to become the new distraction. The felon-in-chief will never surrender the spotlight; he’s a ratings hound.
Let’s hope he has the ability to generalize what he has learned (?) from the Orange Crisis(tm). A “Mar-El-Lago accord” shock is the last thing the world needs.
The Women’s Health Initiative is being shut down as of September:
https://www.npr.org/2025/04/23/nx-s1-5372892/womens-health-initiative-research-funding-gets-cut
This is the longest-running longitudinal study of women’s health of its size in the world. The total budgrt saving from shutting down thr four data-gathering centers is $4 million per year. By way of comparison, reimbursements for Congressional travel without showing recipts cost roughly $5.8 million in 2023. Other travel, requiring receipts, added to the total. During his first term, the felon-in-chief charged the Secret Service $2.5 million for agents staying in the felon’s own facilities, so they could be near the felon. So it’s self-evident that the Women’s Health Initiative needs to be eliminated, for efficiency reasons; it’s just too expensive.
The savings is not $4 million per year untaxed. It is the billions of dollars saved per year by avoiding the issue of medical disparities associated with women and minorities in healthcare. If we never know about the issues, then they are not a problem.
So trump justified his tariffs as a national emergency due to excessive threats of imported goods. We apparently are at war and losing due to trade. Sounds like something rick stryker would teach in his econ and law class.