The current reading of 50.8 is below the 73.4 average reading over NBER peak-to-trough recessions dates (1990M01-2025M03):
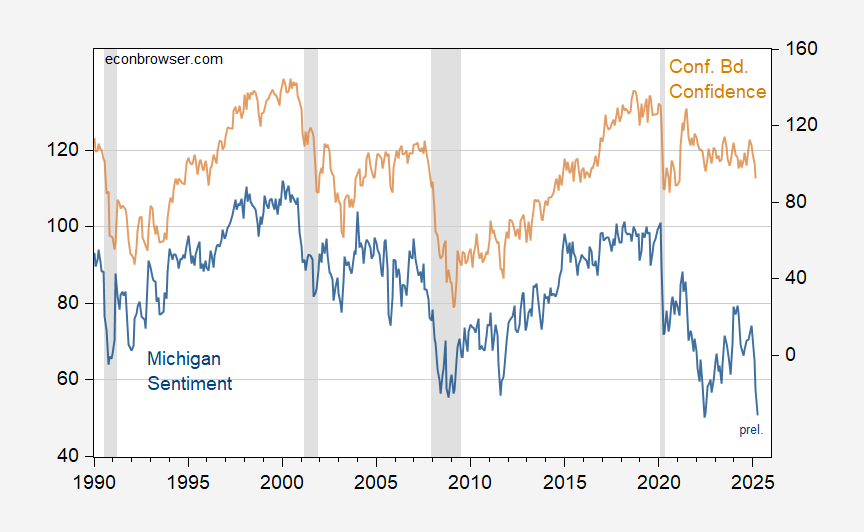
Figure 1: University of Michigan Consumer Sentiment (blue, left scale), and Conference Board Consumer Confidence (tan, right scale). NBER defined peak-to-trough recession dates shaded gray. Source: U.Michigan, Conference Board, NBER.
The same is not true for the Conference Board’s Consumer Confidence measure, at least for March at 92.9 (recession average is 75).
Another way of tackling the question is to use a probit regression to see if contemporaneous values of the Michigan Confidence index predicts (not forecasts) recession.
I estimate over 1990-2025M03 a probit regression of a recession dummy on U.Michigan Sentiment, assuming no recession has occurred through March 2025.
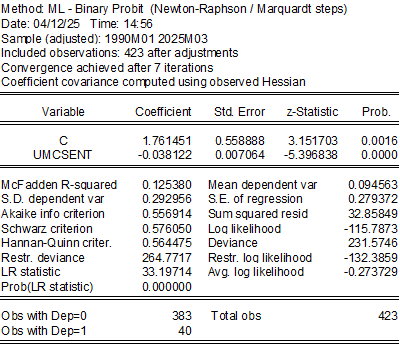
The estimated recession probabilities are shown in blue in Figure 2 below.
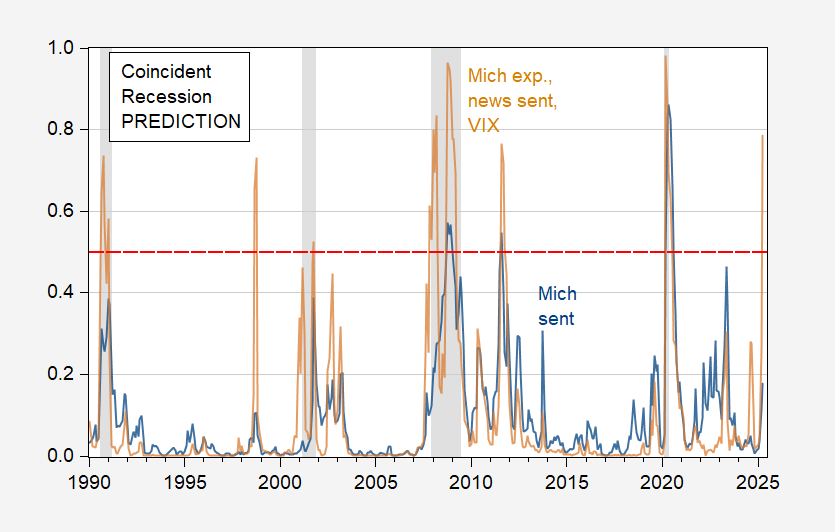
Figure 2: Estimated recession probability from probit regression on Michigan Sentiment (blue), and on Michigan Sentiment, News Sentiment, 1yr-FFR spread, VIX (tan). April data is for news through 4/6, interest rates and VIX through 4/11. NBER defined peak-to-trough recession dates shaded gray. Source: NBER and author’s calculations.
The simple probit indicates a low probability of recession as of April. The pseuo-R2 is fairly low, so it makes sense to use other soft data and financial data. I substitute expectations, and augment the that index with the SF Fed’s News Sentiment index, the 1yr-Fed funds spread (per Miller 2019) for near horizon recession probabilities) and the VIX.
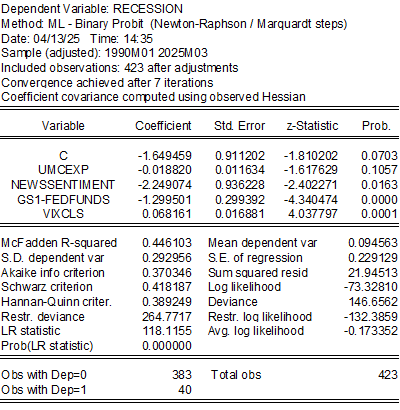
The pseudo-R2 is substantially higher now, while the expectations variable is not as statistically significant. The spread and VIX both enter significantly. The estimated recession probabilities are shown as the tan line, with a value of 77.6% in April. This model has two false positives, and no missed positives.
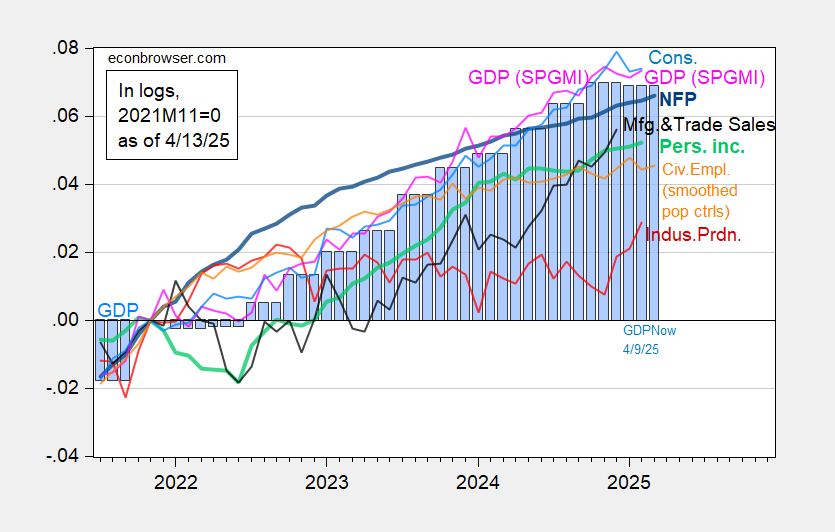
Figure 3: Nonfarm Payroll incl benchmark revision employment from CES (bold blue), civilian employment experimental series incorporating smoothed population controls, spliced to official (orange), industrial production (red), personal income excluding current transfers in Ch.2017$ (bold light green), manufacturing and trade sales in Ch.2017$ (black), consumption in Ch.2017$ (light blue), and monthly GDP in Ch.2017$ (pink), BEA GDP (blue bars), and GDPNow as of 4/9 (blue bars 2025M01-M03, all log normalized to 2021M11=0. Source: BLS via FRED, Federal Reserve, BEA 2024Q4 3rd release, S&P Global Market Insights (nee Macroeconomic Advisers, IHS Markit) (4/1/2025 release), Atlanta Fed, and author’s calculations.
NFP up, civilian employment and monthly GDP trending sideways, consumption down, and Q1 GDPNow is flat vs. Q4.
The Center for Budget and Policy Priorities, working from Yale Budget Lab estimates, reports on the income effects of the Republican budget plan, by income:
https://www.cbpp.org/research/federal-tax/republican-agendas-triple-threat-to-low-and-moderate-income-family-well-being
Here’s the report from the Yale Budget Lab:
https://budgetlab.yale.edu/news/250319/illustrative-distributional-effects-policies-consistent-house-concurrent-budget-resolution-fiscal
CBPP reports that the top 1% of incomes will receive a 2% ($29,630) increase. The top 20% of incomes gains 0.7% ($1,620). That’s it for gains. The remaining 80% lose income.
The Yale analysis reports a less extreme set of changes, with the lowest quintile losing only 5.%, against 9% in the CBPP report. I haven’t figured out the cause of the discrepancy. Yale does note that 101% of the net gain accrues to the top quintile. Anyone surprised?
Often, because those at the bottom earn so much less than the rest, regressive plans hurt them more in percentage terms than higher incomes, but not in absolute dollar terms. Not this time. The CBPP puts the bottom income quintile loss at $2,030. That’s a larger dollar loss than any other quintile.
How the hell do you take 9%, or even 5%, of the income of the poorest families?
By the way, Yale’s analysis takes account of direct losses due to tariffs, but not indirect losses as a result of lost employment. So reality is likely to be worse than reflected in these estimates.
By the way, the House and Senate both passed versions of the budget described in the Yale and CBPP reports while the Orange Crisis ™ was grabbing the headlines. It is my long-held belief that the guns-abortion-racism portion of the GOP agenda serves to distract the plebs, so the unpopular class-warfare part of the GOP agenda can be carried out. Certainly, this week’s events fits the pattern, with tariffs joining the list of distractions.
Seems to me more an indicator of media sentiment than economic sentiment, I wouldn’t put much weight on it. The employment and production data on Figure 3 is much more relevant IMO. If you have information by industry (esp. housing) it would be great to look at it.
Optimistic But Skeptic: We have only employment data for March, none of the monthly indicators for April. I agree that as of March, unlikely that the recession has started.
If one were looking for an explanation for the divergence between hard economic data and sentiment indicators, one might look to the behavior of news organizations, but it’s not clear they are to blame. Some research finds no bias:
https://www.federalreserve.gov/econres/feds/bad-news-good-news-coverage-and-response-asymmetries.htm
Other research finds that the press leans negative, while social media leans positove:
https://journals.sagepub.com/doi/10.1177/0093650217725870
It is perfectly obvious that faux news leans which ever way benefits the GOP, but that doesn’t explain away the latest negative swing in public sentiment.
Whatever the case may be regarding press bias, there is apparently asymmetry in our response, with only negative news causing a shift in public perceptions:
https://phys.org/news/2020-02-negative-economic-news-coverage-newspapers.html
We know that humans are risk averse, which may help explain our asymmetric sensitivity to news.