From GDP Q1 3rd release and nowcasts plus tracking. GDPNow is down on personal income and spending release, advanced economic indicators, as well as the Q1 3rd release.
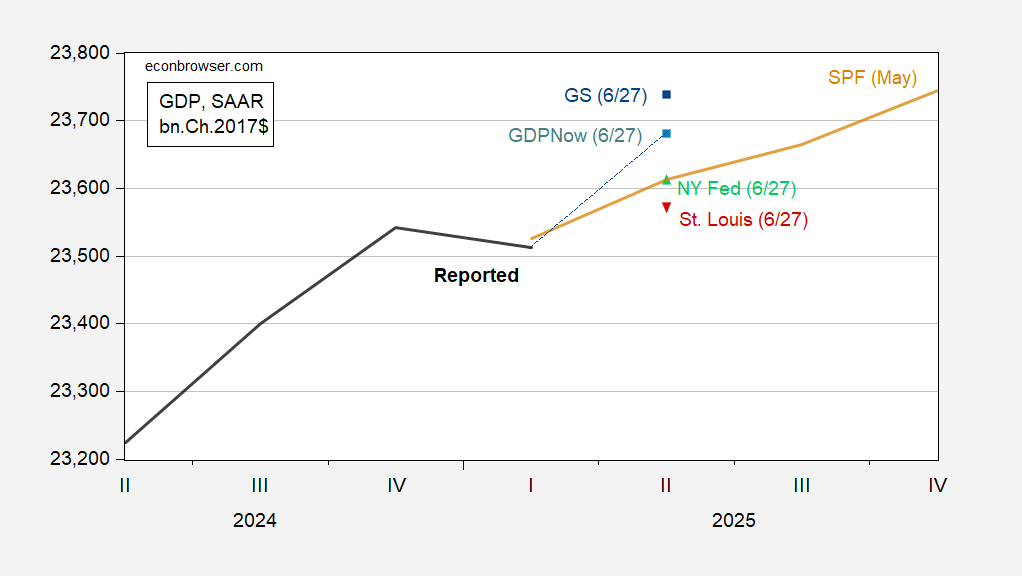
Figure 1: GDP (bold black), May SPF median (tan line), GDPNow (sky blue square), Goldman Sachs (blue square), NY Fed (green triangle), St. Louis News nowcast (inverted red triangle), all in bn.Ch.2017$, SAAR. Source: BEA 2025Q1 3rd release, Atlanta Fed, Goldman Sachs, NY Fed, St. Louis Fed, and author’s calculations.
Given the distortions attendant with tariff front-loading and inventory tracking, it pays to think about aggregate demand (in principle measured by final sales), or trend aggregate demand (in principle measured sales to domestic purchasers, so consumption and fixed investment. This is shown in Figure 2, along with nowcast from GDPNow and Goldman Sachs tracking.
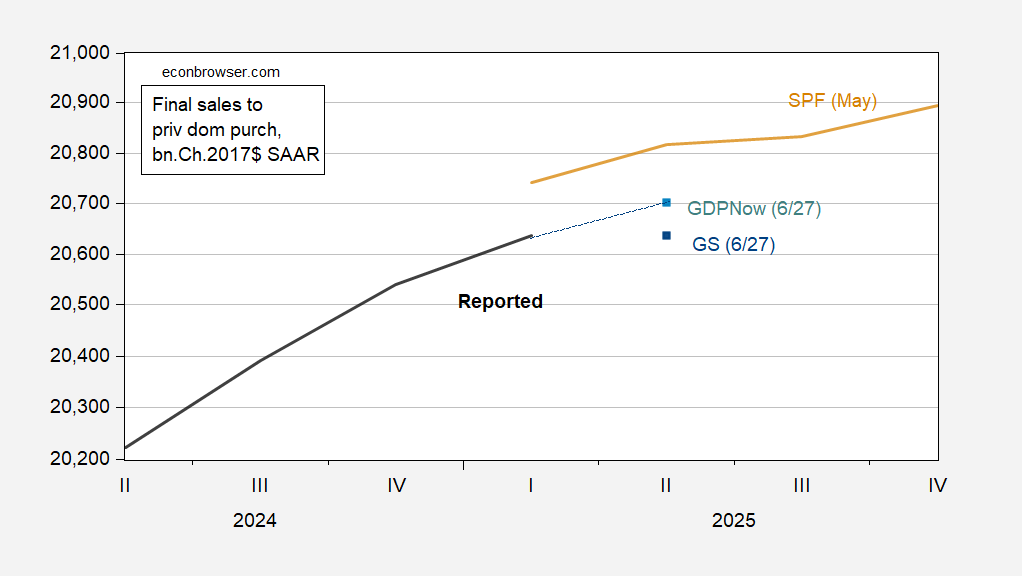
Figure 2: Final sales to private domestic purchasers (bold black), May SPF median (tan line), GDPNow (sky blue square), Goldman Sachs (blue square), all in bn.Ch.2017$, SAAR. Source: BEA 2025Q1 3rd release, Atlanta Fed, Goldman Sachs, and author’s calculations.
Clearly, there is deceleration in this measure, and nowcasted slowing. Interestingly, Goldman Sachs thinks final sales to private domestic purchasers will be flat this quarter.
The latest data release gives us Gross Domestic Income, so also GDO:
Real GDP -0.5%
Real GDI +0.2%
Real GDO -0.3%
What’s up next with income?
Real personal income, levels:
https://fred.stlouisfed.org/graph/?g=1JQyi
Strong gains in March and April provide an advantageous base for Q2 real GDI. The slide in May, on the other hand, suggests a disadvantageous base for Q3.
Same series, annualized % change:
https://fred.stlouisfed.org/graph/?g=1JQwz
Here’s real personal consumption looked at the same way, first levels:
https://fred.stlouisfed.org/graph/?g=1JQyB
And now annualized % changes:
https://fred.stlouisfed.org/graph/?g=1JQyS
Roughly the same story – better for Q2 than Q3. June data will either improve the base for Q3 or hurt it. For now Q3 looks soft, and that’s without the large trade distortions of Q1/Q2.