June NFP beats consensus on the back of education and health services employment, while private NFP surprises downside. With S&P Global monthly GDP flat over the last six months through May, many key indicators followed by the NBER Business Cycle Dating Committee (BCDC) are flat or falling (although NBER places primary emphasis on employment, which is still rising, along with personal income).
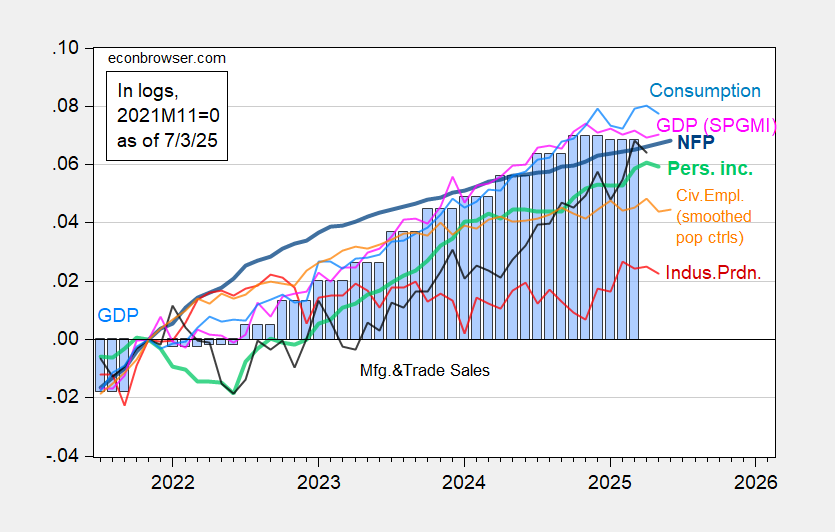
Figure 1: Nonfarm Payroll incl benchmark revision employment from CES (bold blue), civilian employment using smoothed population controls (orange), industrial production (red), personal income excluding current transfers in Ch.2017$ (bold light green), manufacturing and trade sales in Ch.2017$ (black), consumption in Ch.2017$ (light blue), and monthly GDP in Ch.2017$ (pink), GDP (blue bars), all log normalized to 2021M11=0. 2025Q1 GDP is third release. Source: BLS via FRED, Federal Reserve, BEA, S&P Global Market Insights (nee Macroeconomic Advisers, IHS Markit) (7/2/2025 release), and author’s calculations.
Here’s a picture of some alternative indicators.
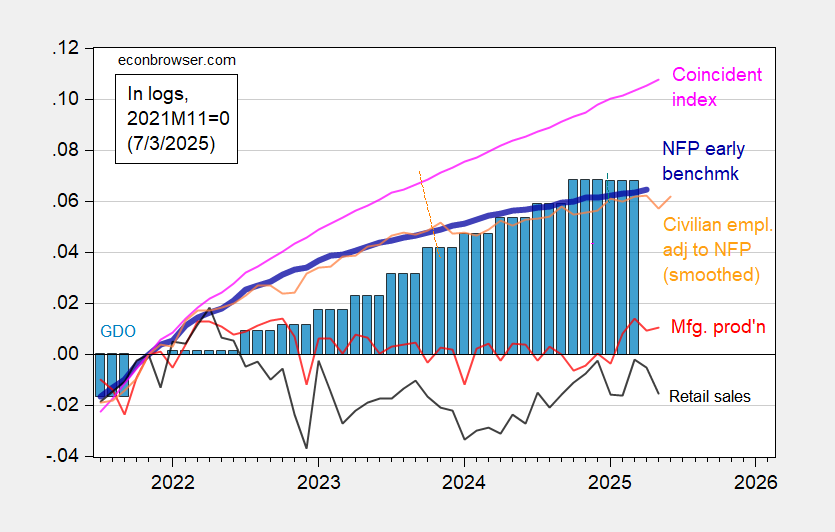
Figure 2: Preliminary Nonfarm Payroll early benchmark (NFP) (bold blue), civilian employment adjusted to NFP concept, with smoothed population controls (orange), manufacturing production (red), real retail sales (black), and coincident index in Ch.2017$ (pink), GDO (blue bars), all log normalized to 2021M11=0. Source: Philadelphia Fed [1], Philadelphia Fed [2], Federal Reserve via FRED, BEA 2025Q1 third release, and author’s calculations.
In general, I put much heavier weight on the CES vs. CPS measures of employment. However, if you’re a believer that the CPS series signals recessions earlier than the CES, well, keep on worrying (there’s actually only mixed evidence in support of this view, using real-time data, see this post).
Note that all these data are backward looking, with employment referring to roughly second week in June. Weekly indicators of economic activity confirm a slowdown starting in April, continuing through the later part of June.
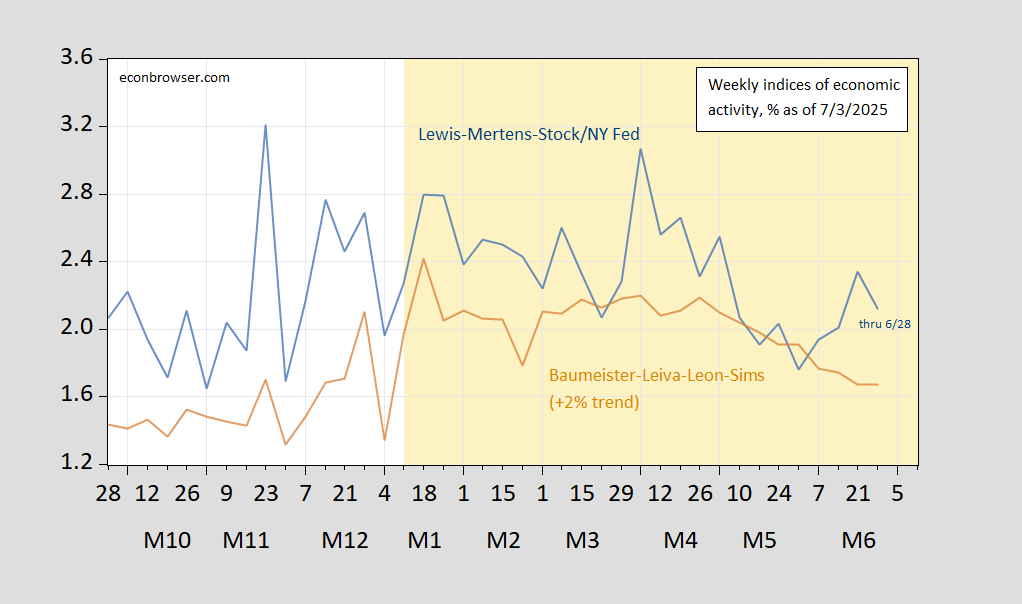
Figure 3: Lewis, Mertens, Stock Weekly Economic Index (blue), and Baumeister, Leiva-Leon, Sims Weekly Economic Conditions Index for US plus 2% trend (tan), all y/y growth rate in %. Source: Dallas Fed via FRED, WECI, accessed 7/3/2025.
Spraking of cyclical indicators, regulars here know that commercial mortgage backed securities (CMBS) have been a more or less perpetual worry since Covid emptied out office buildings and malls. CMBS weren’t all that nice even before Covid.
Fresh news on the health of CMBS comes from Trepp, which reports overall deliquencies up in June, with office CMBS delinquency rate at a record 11.08%:
https://www.trepp.com/
The Mortgage Bankers Association isn’t out with Q2 data yet, but Q1 showed a similar rising trend in commercial real estate delinquencies:
https://www.mba.org/news-and-research/newsroom/news/2025/06/03/commercial-and-multifamily-mortgage-delinquency-rates-increased-in-first-quarter-2025
So here’s an oddity – data on commercial banks’ holdings of commercial real estate loans show a delinquency rate far below rates seen in earlier times of stress. Here’s a comparison of the delinquency rates of all commercial bank loans and commercial real estate loans:
https://fred.stlouisfed.org/graph/?g=1JZdz
Commercial real estate loans actually look pretty good in this comparison. Now, CMBS and commercial real estate loans held on banks’ books aren’t identical categories, but they would seem to have a lot in common.
I point this out because I’m curious about systemic risk. Do the data show that banks have the good stuff, while CMBS holders have the bad stuff? If so, does that mean systemic risk is reduced? Who holds the office CMBS that is performing so badly? Maybe I’ve misunderstood the meaning of the delinquency series on commercial banks’ holdings of commercial real estate debt.
If we’re headed for a slow patch, understanding how economic problems will spill over into finance is going to be important. Interested to hear ideas.