As of today, GDP nowcasts split, but final sales to private domestic purchasers (coined “Core GDP” by Furman) consensus is deceleration.
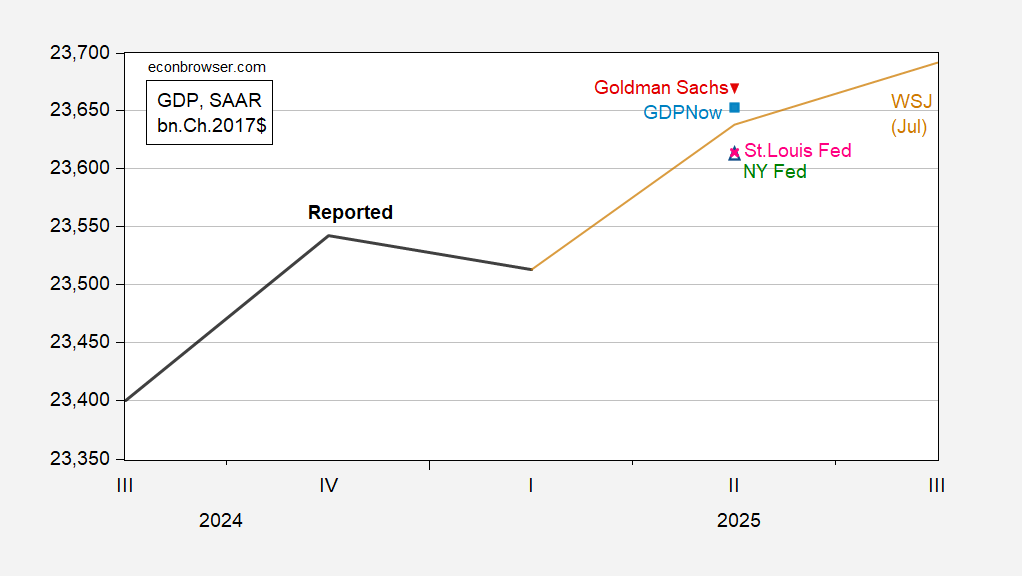
Figure 1: GDP, 3rd release (bold black), WSJ July survey mean (tan), GDPNow (light blue square), Goldman Sachs (inverted red triangle), NY Fed (open green triangle), St. Louis (pink *). All nowcasts are as of 7/25. Source: BEA, WSJ survey, Atlanta Fed, NY Fed, St. Louis Fed, Goldman Sachs and author’s calculations.
At 5 days to the 2025Q2 advance release (on July 30), the Atlanta Fed’s GDPNow has been about as accurate as the Bloomberg consensus, at least in pre-pandemic days. Here’s DeutscheBank’s 2019 comparison.
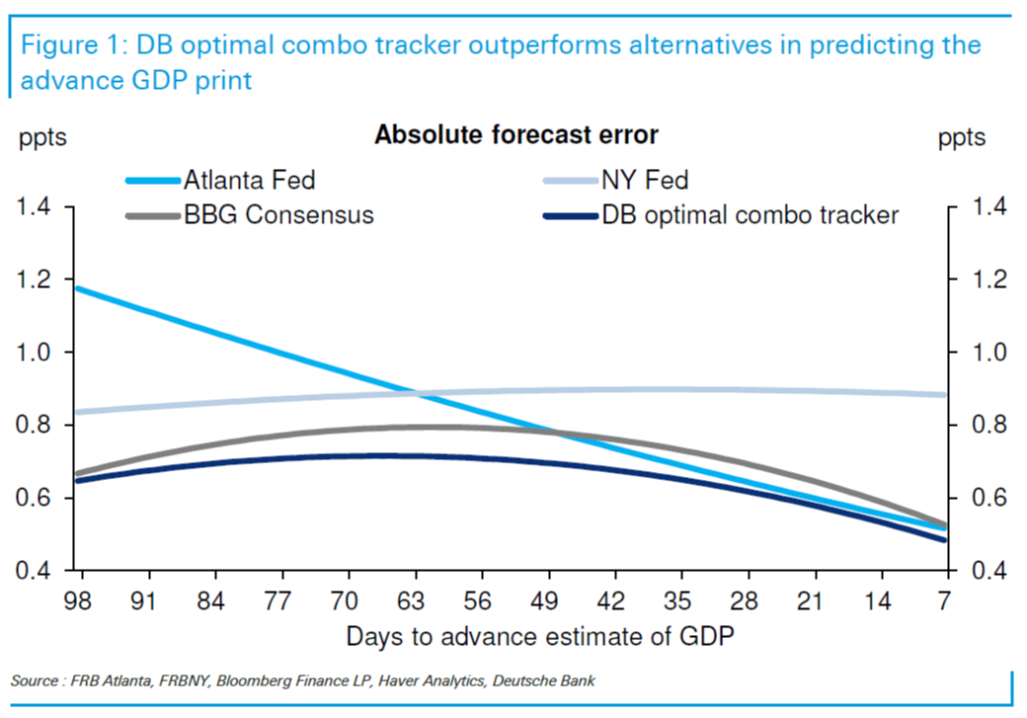
Source: Luzzetti, et al. “Tracking the GDP trackers,” Deutsche Bank US Economic Perspectives, 24 July 2019.
The NY Fed nowcast has been substantially revamped, so the MAE numbers shown above are no longer relevant.
Kalshi betting is on 2.5% as of today, close to GDPNow’s 2.4% q/q AR.
As is by now well known, the GDP measure has been distorted by tariff front-running combined with difficulties in accurately measuring inventory accumulation. Hence, it makes sense to look to domestic private demand for all goods and services. This is proxied by final sales to private domestic purchasers, aka “Core GDP”.
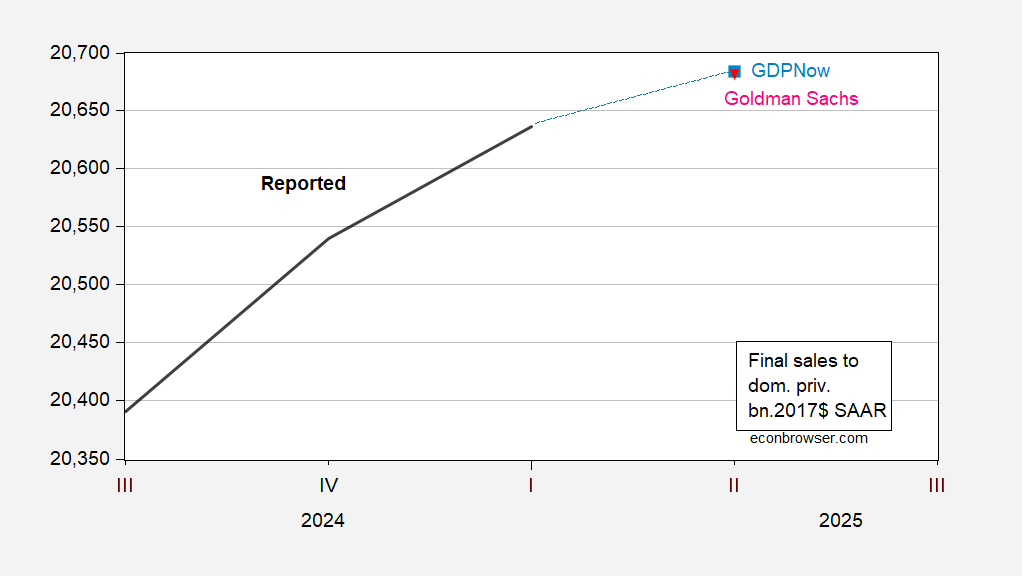
Figure 2: Final sales to private domestic purchasers, 3rd release (bold black), GDPNow (light blue square), Goldman Sachs (inverted red triangle). All nowcasts are as of 7/25. Source: BEA, Atlanta Fed, Goldman Sachs and author’s calculations.
Since the series are drawn on a log scale, the flattening slope is equivalent to decreasing growth rates. Both predictions are for 0.9% q/q AR growth, down from 1.9% in Q1, and 2.9% in 2024Q4.