Real personal income ex-transfers, manufacturing and trade industry sales, civilian employment, civilian employment adjusted to NFP concept, industrial and manufacturing production, real retail sales, vehicle miles traveled, and freight transportation services are all below recent peaks. Other than that, the economy is growing.
Here are indicators followed by the NBER’s Business Cycle Dating Committee, with nonfarm payroll and personal income — key indicators — in bold blue and green respectively.
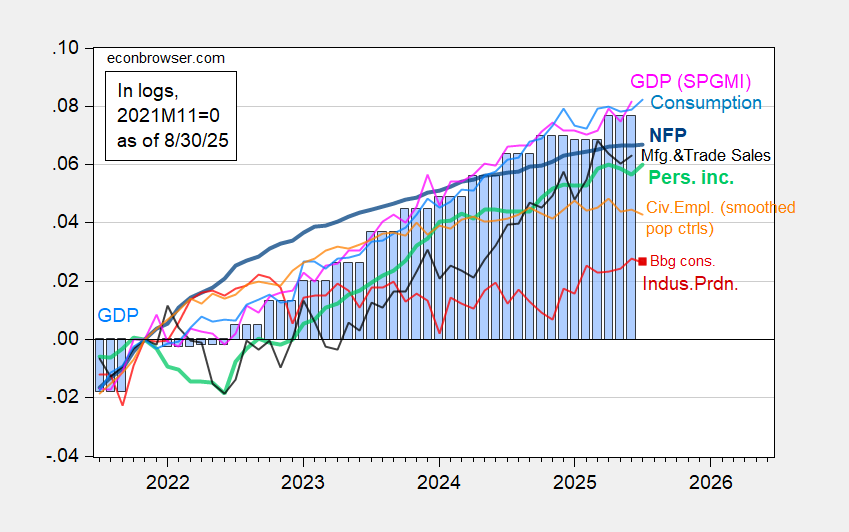
Figure 1: Nonfarm Payroll from CES (bold blue), civilian employment with smoothed population controls (orange), industrial production (red), Bloomberg consensus industrial production of 8/14, (red square), personal income excluding current transfers in Ch.2017$ (bold light green), manufacturing and trade sales in Ch.2017$ (black), consumption in Ch.2017$ (light blue), and monthly GDP in Ch.2017$ (pink), GDP (blue bars), all log normalized to 2021M11=0. Source: BLS via FRED, Federal Reserve, BEA 2025Q2 second release, S&P Global Market Insights (nee Macroeconomic Advisers, IHS Markit) (8/1/2025 release), and author’s calculations.
And alternative indicatrs:
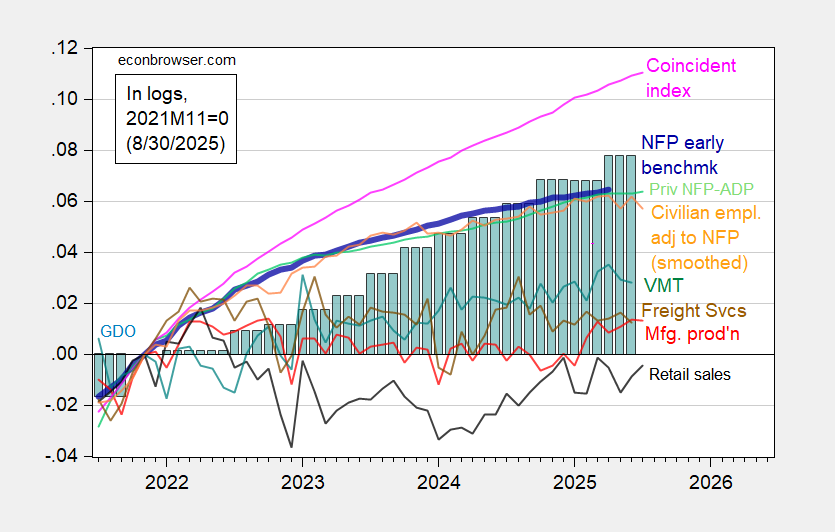
Figure 2: Implied Nonfarm Payroll early benchmark (NFP) (bold blue), civilian employment adjusted to nonfarm payroll concept, with smoothed population controls (orange), manufacturing production (red), vehicle miles traveled (teal), real retail sales (black), and coincident index in Ch.2017$ (pink), BTS Freight Services Index (brown), GDO (blue bars), all log normalized to 2021M11=0. Retail sales deflated by chained CPI, seasonally Source: Philadelphia Fed [1], Philadelphia Fed [2], Federal Reserve via FRED, BEA 2025Q2 second release, DoT BTS, and author’s calculations.