Mark Zandi states that a third of the country is in recession. Here’re some alternative ways of measuring the weakness in the economy, first by geography, second by indicator.
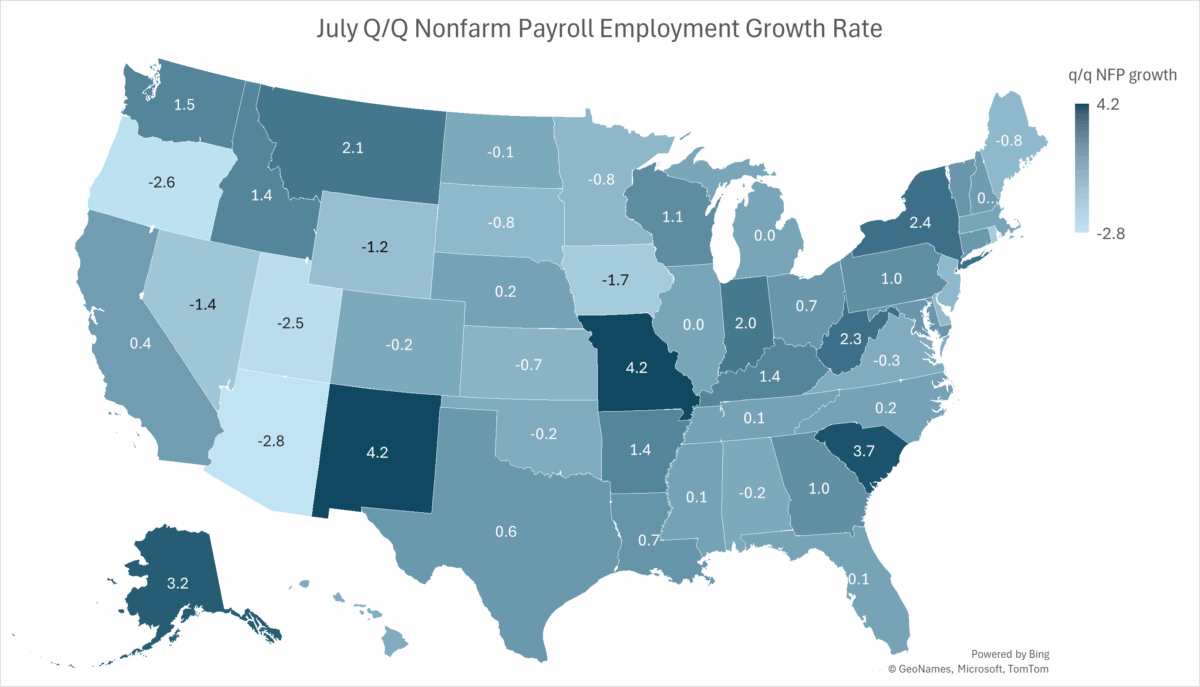
Figure 1: Nonfarm payroll growth, q/q annualized growth through July. Source: BLS, and author’s calculations.
Out of the 51 states plus Washington, DC, 41 have negative q/q employment growth. The states experience the largest negative growth are (in descending order) Arizona, Oregon, Utah, District of Columbia, Iowa, Rhode Island, Nevada, and Wyoming.
The second measure I want to note is for the CFNAI (which is slightly below trend right now).
Index Suggests Economic Growth Decreased in July
The Chicago Fed National Activity Index (CFNAI) decreased to –0.19 in July from –0.18 in June. One of the four broad categories of indicators used to construct the index decreased from June, and three categories made negative contributions in July. The index’s three-month moving average, CFNAI-MA3, increased to –0.18 in July from –0.26 in June.
The CFNAI diffusion index is shown below.
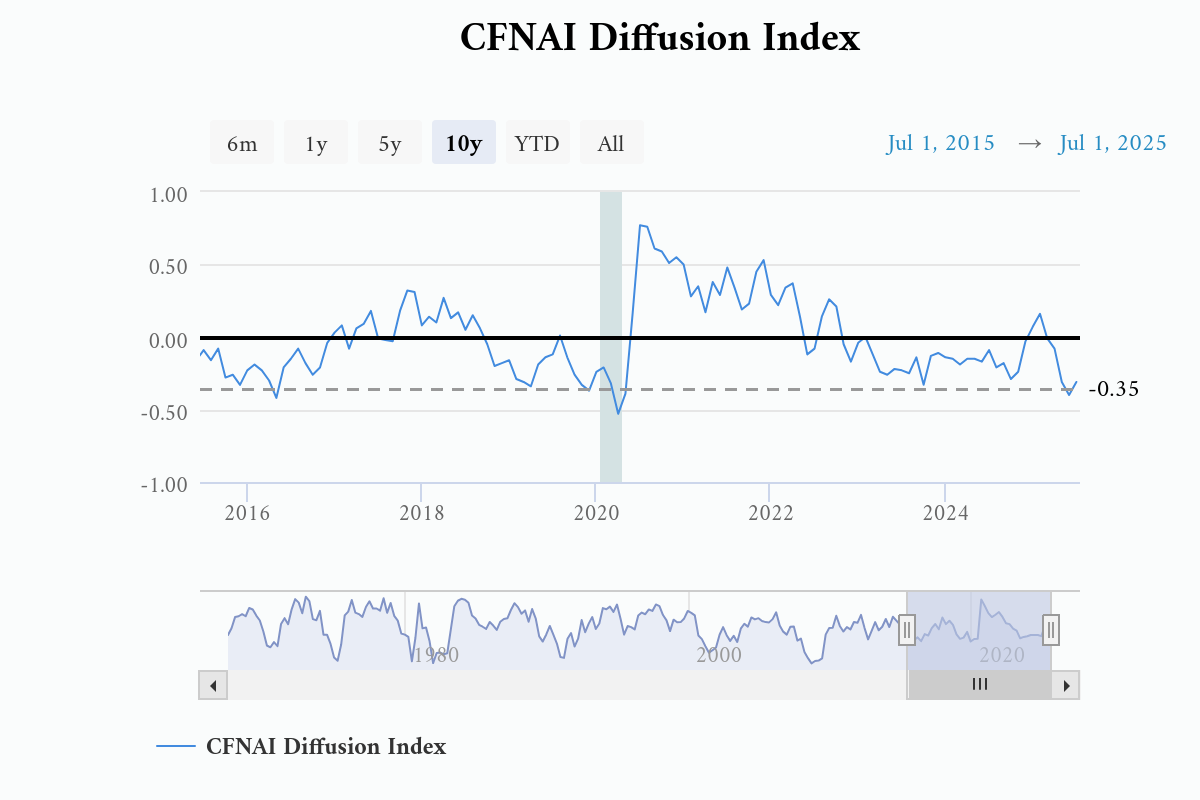
Figure 2: CFNAI Diffusion Index. Source: Chicago Fed.
From the Release:
Notes: Shading indicates official periods of recession as identified by the National Bureau of Economic Research. The CFNAI Diffusion Index represents the three-month moving average of the sum of the absolute values of the weights for the underlying indicators whose contribution to the CFNAI is positive in a given month less the sum of the absolute values of the weights for those indicators whose contribution is negative or neutral in a given month. Periods of economic expansion have historically been associated with values of the CFNAI Diffusion Index above –0.35.
Zandi’s map kinda suggests that the “smile” states didn’t grow faster than the rest of the country in Q2. I’m curious whether that is now a persistent state of affairs.
What drove “smile” growth during the hot period was cost. Lower land cost, TVA electricity, low labor cost all helped. Low land cost meant lower housing costs, which goosed the cycle even more. People wanted to move to where houses were cheap, so housing construction was strong, labor available, adding to growth. Is that done? Certainly not in July:
https://www.realtor.com/news/real-estate-news/housing-starts-census-data-july-2025/
However, since the Fed clamped down in 2022, the Southern census region has lagged the country as a whole in housing starts. Don’t want to obsess over “housing is the business cycle”, but there’s clearly a connection.
Little dyslexia in your analysis of that first chart?