Discussed the employment numbers on WPR this morning. One question came up, which inspired this post – how’s Wisconsin doing, tradewise, given the states’ trade/manufacturing dependence.
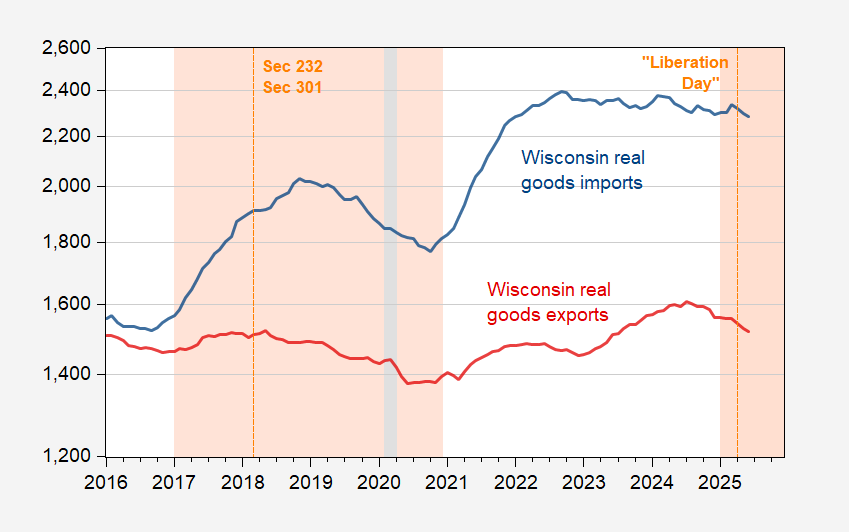
Figure 1: 12 month trailing moving average of Wisconsin goods exports deflated by US goods export price index (red), imports deflated by US goods imports price index (blue), both in millions 2000$, monthly. Source: Census, BLS, via FRED, and author’s calculations.
Real exports were declining even before the election, but showed a drop in in November, onward. Imports started dropping in March. Note that for a variety of reasons, the state level imports and exports are subject to some additional error (e.g., grain exports might be attributed to Louisiana rather than Wisconsin because that’s where they’re exported from; still, there’s little reason to believe the bias has changed since before “Liberation Day”.
What about manufacturing?
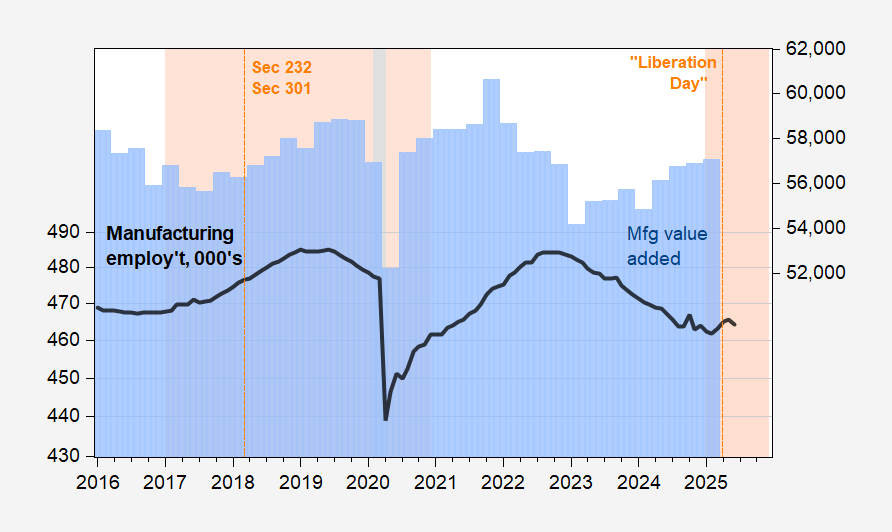
Figure 2: Wisconsin manufacturing employment,000’s (black line, left log scale), Wisconsin real manufacturing value added, mn Ch.2017$, SAAR (blue bars, right log scale). Source: BLS, BEA.
We don’t have value added – the most comprehensive indicator – for the 2nd quarter, which would include post-“Liberation Day” data. However, growth seems to have tailed off. Manufacturing employment is now declining in June (preliminary). Since (3 month) changes in Wisconsin manufacturing employment are correlated with changes in US manufacturing employment with a coefficient of 0.91 (R2 of 0.48, 2022-2025), it’s likely that