With the outsized jump in the PPI, the natural question to ask is whether this implies a jump in the CPI. The evidence is mixed in terms of the aggregate PPI and the aggregate CPI, as noted in this post. More recent analyses suggest the PPI contains predictive power.
Clark (1995) provides a skeptical view that PPI’s provide additional systematic predictive power. Caporale et al. (2002) uses a more formal multivariate approach to conclude that for G-7 economies, PPI’s do lead CPI’s. Whether these findings still pertain in the current environment (and using the updated versions of the PPI) remains to be seen.
Williams, (Empirical Economics, 2024) notes:
we identify several weighted disaggregated [PPI] series that unidirectionally influence or “cause” consumer price inflation providing valuable information for forecasters and policymakers. … we ascertain that three specific disaggregated producer price indices alone account for approximately two-thirds of the variation in consumer price inflation forecasts [over the 2012-2021 period]
These three categories are WPU05 (fuels and related products and power), WPU10 (metals and metal products) and WPU12 (furniture and household durables). I plot these series over the ten months below, along with CPI.
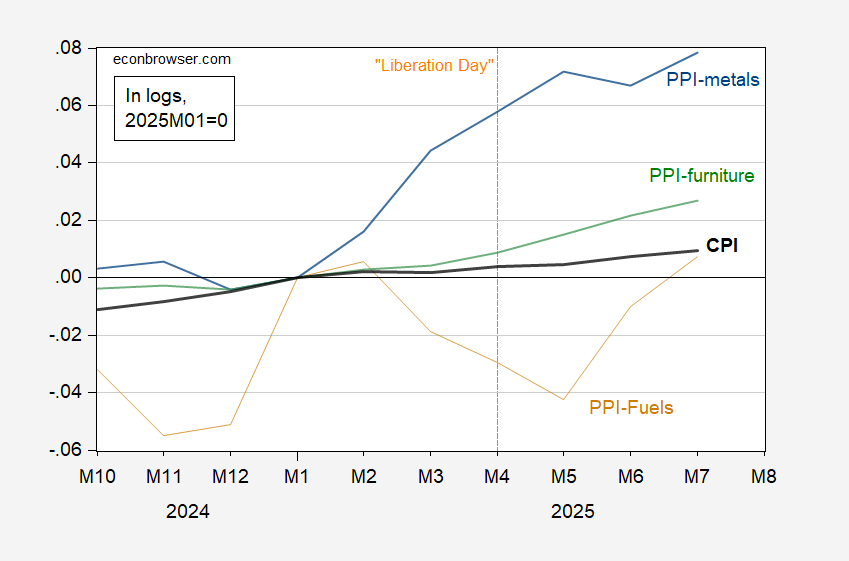
Figure 1: CPI (bold black), PPI fuels (tan), PPI-metals (blue), PPI-furniture (green), all in logs, 2025M01=0. Source: BLS, and author’s calculations,
Note that PPI fuels has a high variance relative to PPI-furniture and PPI-metals, and the link to the CPI is hard to see in such a short sample. For our purposes, this is not critical, as no tariffs have been applied to crude oil (to my knowledge).
Plotting the aggregate PPI and CPI, it becomes clear why it might be difficult to identify the relationship, as well as the (Granger) causality.
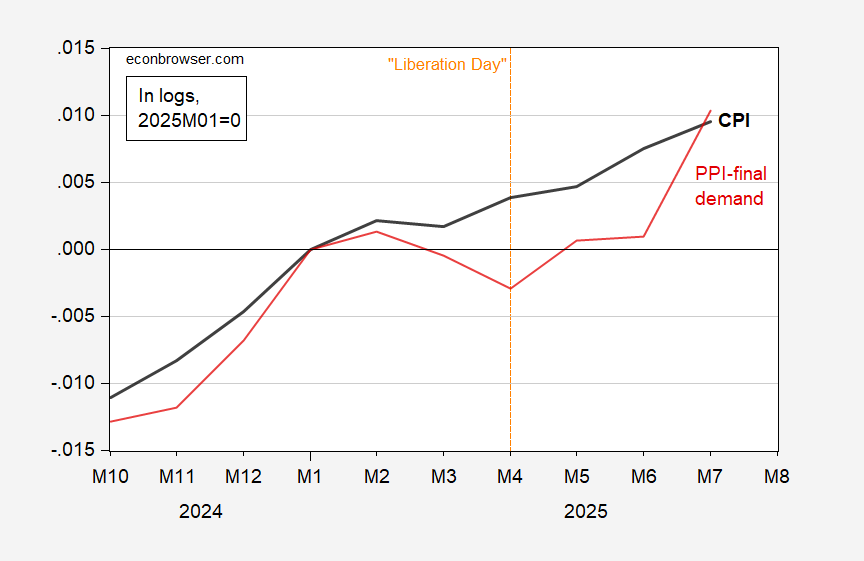
Figure 2: CPI (bold black), PPI – final demand (red), all in logs, 2025M01=0. Source: BLS, and author’s calculations,
I haven’t replicated the analysis and determined the estimated CPI inflation for 2025M08, but the fact that PPI-metals and PPI-furniture are rising suggests upward pressure on the CPI.
This is a relationship which has likely been affected by modern business practices.
From 1948 through the turn of the Millennium, a YoY% increase in the PPI for finished goods more than CPI was an excellent leading indicator for recession, presumably because companies, squeezed by costs, started cutting back production and laying off workers:
https://fred.stlouisfed.org/graph/?g=1LBpb
Since then, however, it has had little predictive power at all. My best hypothesis is that this is a result of the widespread “just in time” inventory systems, whereby companies instant cut back on procurement of materials once their cost increases exceeded their pricing power. Less accumulated inventory meant less of a need to cut back subsequently. It has likely also been affected by the rapid decline in goods production as a share of the U.S. economy.
Whether that remains the case in the face of the tariff situation, we will just have to find out.
The final point is a good one. My understanding is that JIT inventory management went hand-in-hand with mostly offshore outsourcing. We offshored the goods/inventory cycle, so offshored some of the amplitude of the business cycle.
The final point is a good one. My understanding is that JIT inventory management went hand-in-hand with mostly offshore outsourcing. We offshored the goods/inventory cycle, so offshored some of the amplitude of the business cycle.