Courtesy of Ed Yardeni:
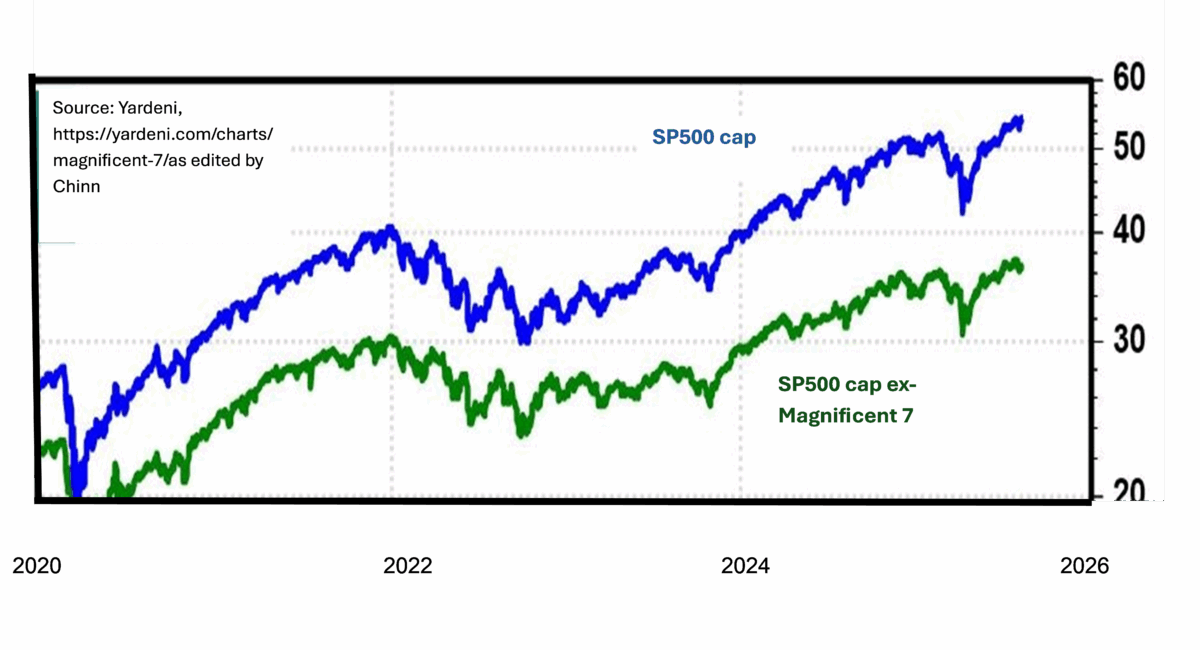
Source: Yardeni as edited by Chinn.
In terms of assessing how the general economy is responding to tariff and other uncertainty shocks, one might want to look at the SP500 excluding the Magnificent 7. As of August 8, SP500 market cap was $54.2 trillion; ex-Magnificent 7 was $36.7 trillion.
Hence, the stock market is looking quite good partly because of the performance of Apple (AAPL), Amazon (AMZN), Alphabet (GOOGL), Meta Platforms (META), Microsoft (MSFT), Nvidia (NVDA), and Tesla (TSLA) stocks. The question is whether this outperformance is durable.
One might say that the cyclically adjusted Price-Earnings (CAPE) ratio is not quite up to 2021M11 levels, so not to worry. I’ll just note that inflation expectations adjusted 10 year rates are now much higher: 2.1% in May vs. -1.0%.
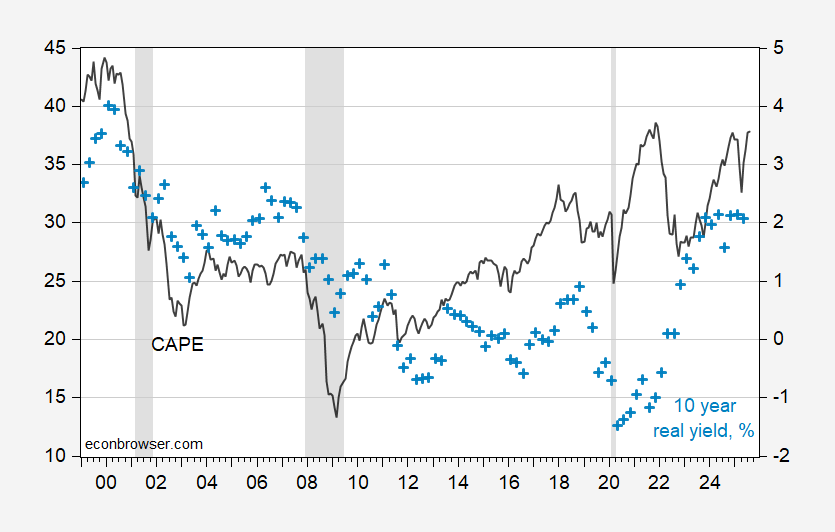
Figure 1: Cyclically adjusted price-earning (CAPE) ratio (black, left scale), and ten year ex ante real rate, % (light blue +, right scale). Real rate calculated by subtracting 10 year median SPF expected inflation rate from 10 yr Treasury yield. August CAPE observation based on data through 8/8. NBER defined peak-to-trough recession dates shaded gray. Source: Shiller, Treasury via FRED, Philadelphia Fed, NBER and author’s calculations.
Cape is as high in general to 2021. So yeah, its a problem. Margin debt is even higher.
This seems concerning: “SCOOP: Trump’s team is considering longtime Bureau of Labor Statistics critic E.J. Antoni to run agency just after president fired Erika McEntarfer”
https://x.com/schwartzbWSJ/status/1954660412407922766
And, he’s announced Antoni’s nomination.
https://www.cnbc.com/2025/08/11/trump-antoni-bls-statistics.html
I don’t think their relative market cap is the biggest issue. More salient is how concentrated earnings have become. In the aggregate the S&P 500 set another all time earnings record in Q2:
https://advantage.factset.com/hubfs/Website/Resources%20Section/Research%20Desk/Earnings%20Insight/EarningsInsight_080825.pdf
But a month ago.Earnings Insight forecast that “ In aggregate, the “Magnificent 7” companies are expected to report year-over-year earnings growth of 14.1% for the second quarter. Excluding these seven companies, the blended (combines actual and estimated results) earnings growth rate for the remaining 493 companies in the S&P 500 would be 3.4% for Q2 2025”:
https://insight.factset.com/are-magnificent-7-companies-still-top-contributors-to-earnings-growth-for-the-sp-500-for-q2
CNBC says today that the magnificent 7 stocks profits grew 26% in Q2:
https://www.cnbc.com/2025/08/04/sp-500-earnings-growth-would-be-dull-without-26percent-increase-from-mag-7.html
One of the important things I look at is the advance-decline line, I.e., how many of the companies’ stocks are participating in the rally? Here they are:
https://www.marketinout.com/chart/market.php?breadth=advance-decline-line
Every market segment is currently showing no net advances in the past month, and a few of them are showing significant declines. In other words, the vast majority of companies have shown pedestrian earnings growth, and have had pedestrian stock price advances, if at all.
I don’t think the advance-decline is a big problem yet. If memory serves, the A/D line had about a 50% decline from peak before the tech bubble popped in 2000.
Very nice. A question:
Having never given A/D analysis much thought until now, I’m curious whether a 50% decline ahead of one of the worst stock market declines in U.S. history amounts to a special case. Did it take an investing public too engaged in speculative buying to notice anything but their object of speculative buying to create that situation? Might we look for either a smaller decline in the A/D line to lead to a decline in overall equity market value in more common cases?
While we’re at it, bullishness, as measured by a good many conventional bull/bear indicators, is high. Here’s the CNNMoney indicator, with components:
https://edition.cnn.com/markets/fear-and-greed
To NDd’s point about market breadth, the McClellan Volume Summation Index (a component of the CNN indicato), which is one method for comparing the number of gainers to losers, is neutral.
I understand that portfolio cash levels are relatively low, despite a fairly good return to cash. Another contrarian indicator; not much fuel for additional gains.