Per release today. In standardized terms, U.Michigan Sentiment and Conference Board Confidence are at the same level in September.
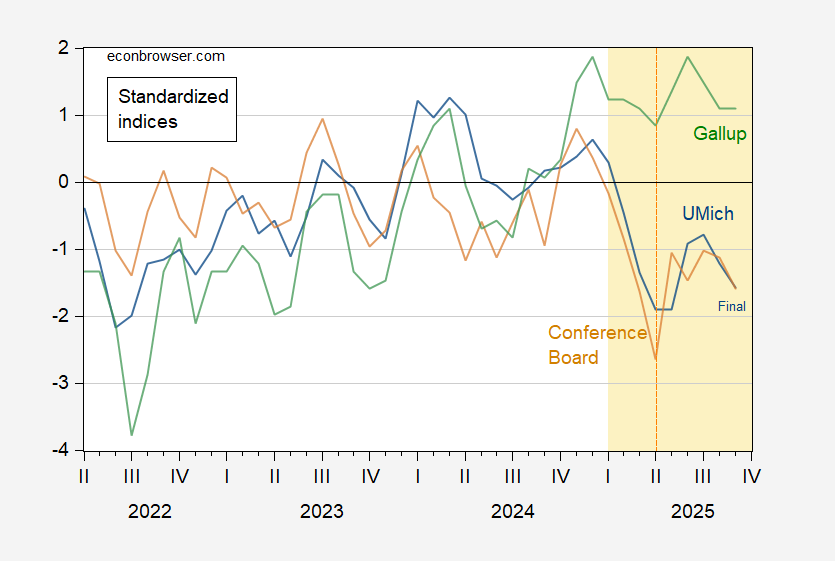
Figure 1: U.Michigan Economic Sentiment (blue), Conference Board Confidence Index (brown), Gallup Confidence (green), all demeaned and divided by standard deviation 2021M01-2025m02. Red dashed line at “Liberation Day” Source: UMichigan, Gallup, Conference Board, and author’s calculations.
As is well known, there’s considerable heterogeneity by partisan affiliation, demographics, and income. Linking in with the remarkable persistence of consumption growth with low confidence/sentiment is the heterogeneity across income terciles, as enumerated by the U.Michigan survey.
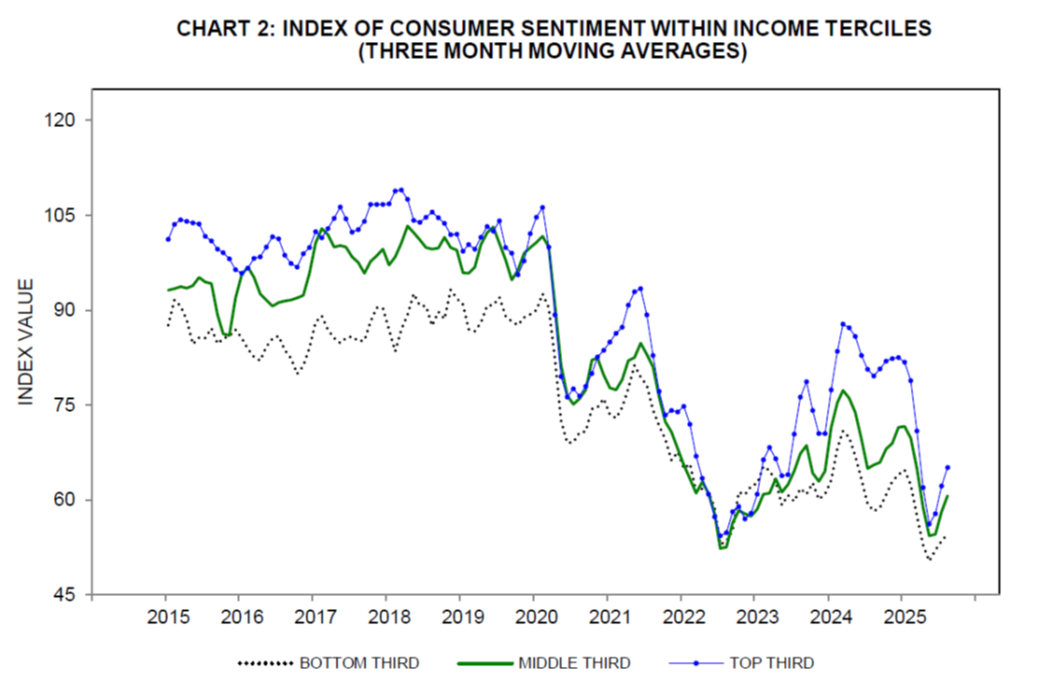
Source: U.Michigan, accessed 9/30/2025.
Confidence is lowest in the lowest income tercile, and highest in the highest tercile, which accounts for most of the consumption spending. In other words, a population weighted sentiment index doesn’t mecessarily match up with a dollar-weighted consumption metric.