NEC Director Hassett makes reference to a GS note that indicates that August preliminary figures typically get revised up (NBCNews) The GS note (Walkers/Rindel, Sept 4) cites a 61K downward bias in preliminary vs. third release… so +22 becomes +83K.
I think I understand this point; what I do to check what seasonal adjustment processes affect things is to compare how different a 12 month change in the not-seasonally-adjusted series is from the corresponding change in the seasonally-adjusted series. Here’s the comparison.
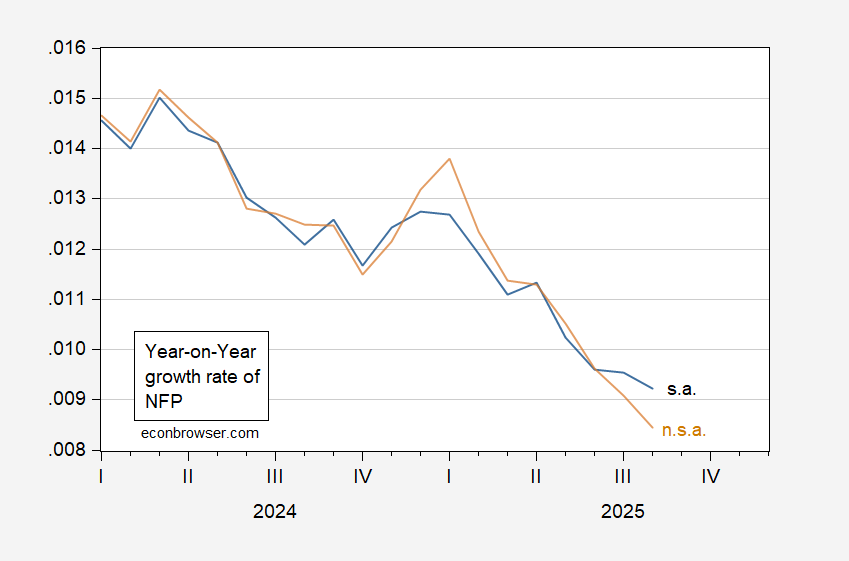
Figure 1: 12-month log difference in seasonally adjusted NFP (FRED series PAYEMS) (blue), and in not-seasonally-adjusted NFP (FRED series PAYNSA) (tan). Source: FRED, author’s calculations.
The 12 month growth rate for the n.s.a. series is lower than that for the s.a. series. Not proof positive that seasonal adjustment processes aren’t doing something strange – just putting bounds on how much you can look to seasonal adjustment to make the outlook appear less dismal.
As an aside, industrial production is not at an all time high; the July reading was slightly below the June reading. More significantly, capacity utilization in July (77.5%) was down from the June 2024 rate of 78.2%.
August and September typically have the smallest of monthly seasonal adjustments:
https://fred.stlouisfed.org/graph/?g=1M5FK
Hassett’s excuse for August probably doesn’t explain weak readings in May, June and July, so focusing on August looks like misdirection.
Assuming Goldman is right (and that Hassett accurately represented Goldman) about the average revision, I’m not sure that seasonal adjustment would be the likliest explanation. A directional bias seems more likely to result from sampling problems.
Anybody have Goldman’s note?
‘Scuse me. I should have written that July and August typically have the smallest seasonal adjustments.
Kevin Hassett today on CNBC: “Members of my family have been hired. Both of them started their new jobs about a week ago. And so you are seeing that people are being hired.”
Well then, let’s just scrap that error prone BLS survey of 120,000 businesses. We can just go with anecdotes about Hassett’s grandchildren. Everything is fine!
FWIW, a forecaster I respect, who has been parsing jobs reports for decades for his subscribers also suggested that there might be some seasonal quirks in this summer’s reports, mainly due to the way they have handled jobs in the education sector.
But, to Hassett’s argument, seasonal adjustment issues work both ways. It’s true that May was somewhat of an outlier to the downside, but as the below graph which shows the difference between the SA and NSA monthly numbers shows, August’s SA number was one of the 3 highest in the entire last decade to the upside. In other words, a “regular” SA almost certainly would have shown an outright decline in jobs in August:
https://fred.stlouisfed.org/graph/?g=1M6r9
Also, the year over year increase in jobs, even seasonally adjusted, at 0.9%, is a level that with only one exception in the past 80 years has only been seen in or just before recessions (and semi-annual revisions from the QCEW that are coming out on Tuesday will almost certainly make it even lower). And for YoY comparisons, I think the NSA numbers probably come a little closer to the truth, and they are only up 0.85%
U.S. demographics make historic employment growth rates tough to maintain. Both the population and the labor force now grow more slowly than in the past:
https://fred.stlouisfed.org/graph/?g=1M70k
Nothing new in this observation. Your point, however, about slow employment growth as a sign of recession, raises a serious issue – what is a recession when the growth of inputs slows to near zero?
In the near term, that’s very much a question about immigration, but in the longer term, it’s more a question about, well, still about immigration. Or about realistic economic policy goals in the face of near-zero population growth.
Japan has been through this already and is widely cited as an example of the likely future for most countries. I’m not wild about an n=1 sample, but Japan is what we have, along with Italy, Russia and a few others.
I digress.
So on to a related issue. It seems entirely possible that there is a stall speed to the U.S. economy which which is higher than the growth rate of the labor force. Debt service, investment hurdle rates and all of that stuff could mean that output slows more than growth in the labor force, at some slow pace of labor force growth. Real compensation for example, has slowed, on trend, along with slowing growth of employment:
https://fred.stlouisfed.org/graph/?g=1M75k
What happens to demand, and to household debt service, as this trend continues?
In Japan, gross fixed capital formation fell from a high of 40% in 1973 to 26% fifty years later. Rather than speeding up to replace workers, capital formation slowed along with growth in the workforce. (Other stuff going on, too, I realize.) If we follow this pattern – and we have so far – capital inputs won’t make up for declining labor input. So not stagflation, but plain old stagnation.
Massive domestic saving and massive overseas assets make Japan a different case than the U.S. Japan is in a position to sell foreign assets – live off its savings – whereas the U.S. would have to sell off domestic assets – eat the seed corn. Mathematically, I suppose both lead to the same thing – reduction in domestically-owned assets. But that is a fairly simplistic bit of math, and math isn’t everything.
I have wandered way off the track. Job growth of 0.9% y/y is, as you point out, very low for a growing economy. Even if slower labor force growth means we need less job growth to avoid recession, 0.9% is low. Very low.