I estimated three models, 2021-2025M08, resulting in adjusted R2 of between 0.54 (based on ADP data) to 0.71 (based on ADP data). Here’s what I got for forecasts of September and October private NFP as reported by BLS:
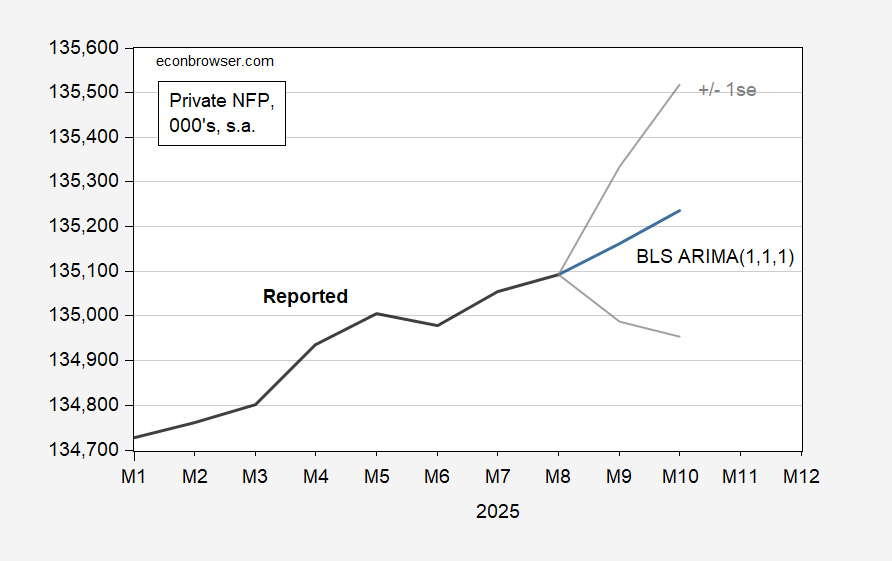
For the ARIMA(1,1,1) in the preliminary benchmark BLS series.
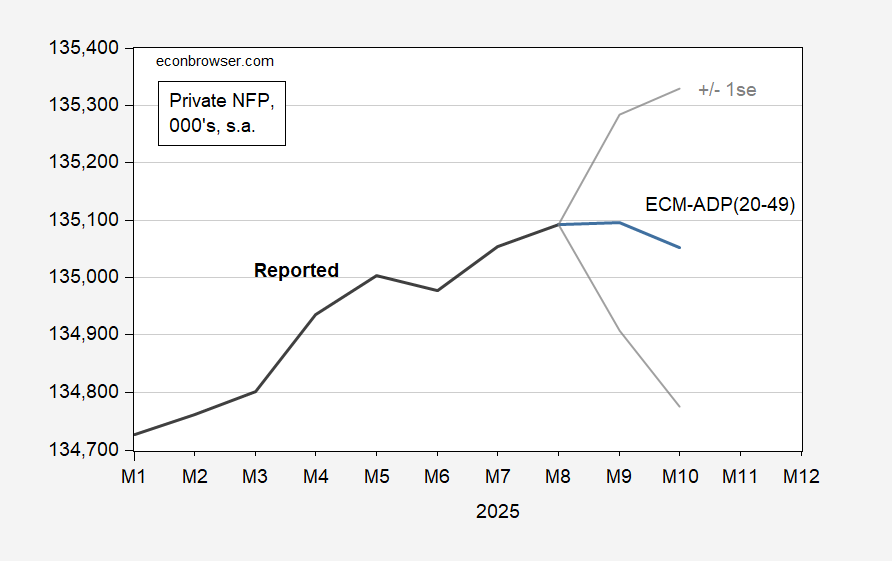
For an ECM in the ADP ratio of total private NFP to employment in firms 20-49:
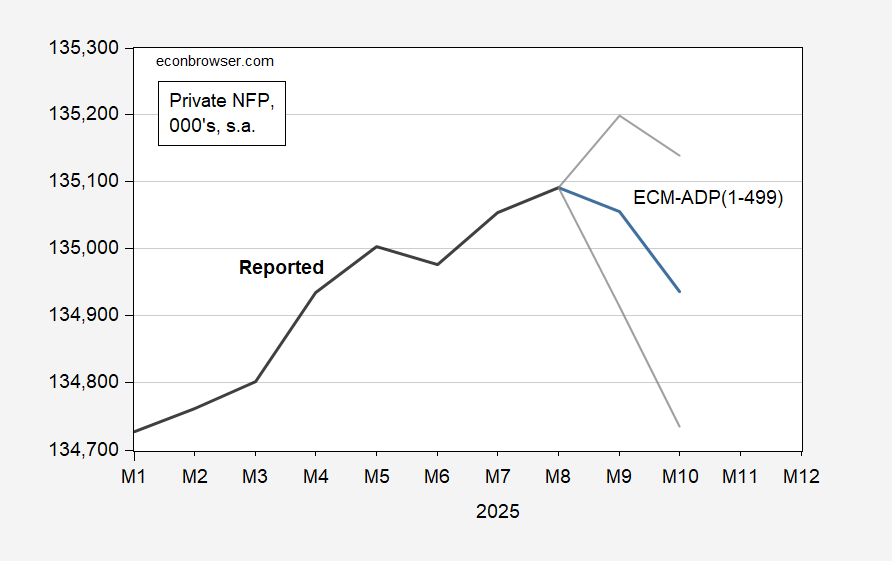
For an ECM of private NFP to firms 1-499:
A comparison:
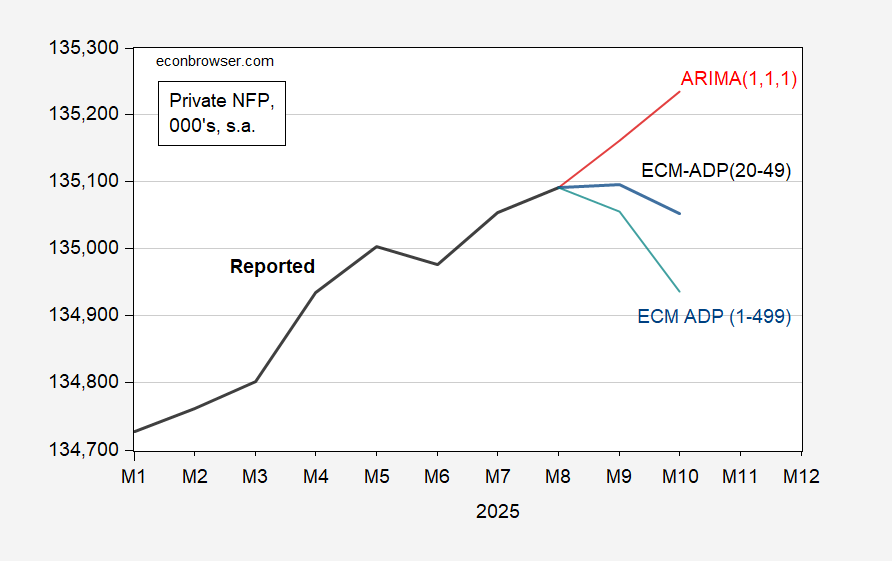
Obviously, without much difference between adjusted R2‘s, there’s not a lot of basis to choose one over the other, although the adjusted R2 for an ECT involving employment in firms 1-499 employees vs. total private has the highest (at 0.71). Using the highest R2 specification, change in employment is -36K and -199K in September and October (although increases are entirely possible given the large prediction intervals).
One interesting point is that I can reject the null hypothesis that the ratio of firm employment 1-499 to total private Granger causes the log difference in BLS private NFP (at 10% msl), but not the reverse.
The Hill thinks it has identified critical dates for passage of the budget:
https://thehill.com/homenews/senate/5561093-shutdown-end-dates-to-watch/?
The theory is that paying this or that category of worker is important to lawmakers. We’ll see.
Off topic – Corruption? You ain’t seen nothing yet.
The felon-in-chief also happens to be a blatant self-dealing swindler, so we should keep an eye on anything that could generate large flows of money. If there is a flow, there is the potential to divert some part of that flow to rent-seeking scoundrels. I have mentioned Venezuela’s oil sector as a likely target for the felon and his friends. Here’s another one:
https://www.wsj.com/finance/regulation/trump-aiming-to-ipo-fannie-mae-and-freddie-mac-later-this-year-13b138cf?mod=article_inline
The sale of shares in Freddie and Fannie is expected to generate $30 billion, topping the previous largest-ever IPO of Aramco shares, at $25.6 billion. What’s the take on $30 billion for the investment bank(s)? Apart from the up-front cost, let’s say underwriting fees of 3%. That’s $90 million.
How much vig could the felon demand for that $90 million? Your guess is as good as mine.
Keep in mind, one of the reasons the GSEs haven’t already been privatized is that potential investors have insisted on leaving much of the risk and bad debt behind while acquiring only the good parts. If this deal goes down, will it be because this administration is willing to give investors everything they want, unlike previous administrations?
One more thing – this is an IPO, and the “initial” part is a big deal. As the link indicates, the GSEs are valued at around half a trillion dollars; the initial share sale represents less than 10% of that value. Fees on $500 billion, at 3%, would amount to $15 billion. And there’d be up-front money for each round on top of that. That’s real money, even for Wall Street. And if the felon sweetens the deal at Treasury’s (our) expense, the fees are only part of the bonanza. The felon could demand vig amounting to more than he has previously claimed to be worth.
This is how it’s done in corrupt countries. The U.S. is now a corrupt country. Get used to it.
By the way, the financial press speculated that underwriting fees for the Aramco IPO ran north of 5%:
https://www.nsenergybusiness.com/company-news/saudi-aramco-ipo-fees/
The 3% figure I used in my example is at the low end of likely underwriting costs.
I was trying to get data on Auto loan delinquency rates after seeing a related article on NYT. Has anyone else noticed it’s hell getting info off of FRED today, due to what they label “technical difficulties”??
Cages Longlegs: AWS outage I believe.
‘ppreciate the clarification. I rechecked, the FRED links were working about 4 minutes ago. Who knows how long that will last??—sounds like AWS is better but still “spotty” at the moment (20:42 CST)
Until FRED gets over its booboo:
https://ycharts.com/indicators/us_auto_loans_delinquent_by_90_days
Narcissism at work:
https://www.washingtonpost.com/politics/2025/10/20/white-house-begins-demolishing-east-wing-facade-build-trumps-ballroom/
This is such a great metaphor. Wrong House, maybe, but the point is clear.
My best estimate for September’s BLS private employment is up 49,000 from August. (Using a BVAR(6) with ADP and BLS numbers, because that’s my comfort zone.) If we ever get the numbers, I’ll check back and see how I did.