The reason that UMich’s fake inflation expectation data can sometimes rise when all 3 components (R’s, D’s, and I’s) decrease is b/c the survey will include way fewer R’s and I’s but more D’s; the Marxist profs are effectively screwing w/ weights b/c they can’t change responses:
As I have noted in other instances regarding Dr. Antoni’s commentary (most enumerated in this post), it would be helpful if he referred to technical documentation before calling something “fake”.
Here’s the partisan affiliation over time, from an April report:
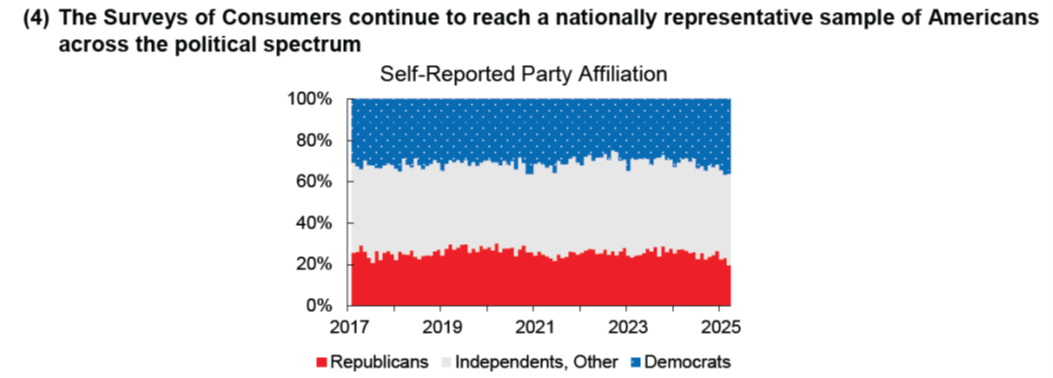
Source: U.Mich, April 2025.
As far as I can tell, there are fewer Republicans, roughly stable independents. Not sure I’d say “way fewer” as Dr. Antoni characterizes it.
Moreover, if Dr. Antoni thinks the fact that at certain times Democrats outweight Republicans in the sample means the data are “fake”, then he must think all of the voting polls are “fake”, insofar as the samples are never exactly proportionate to each demographic/partisan grouping. (And I don’t recall Dr. Antoni making a similar argument in 2022 when Democratic proportions dropped.).
From the report:
The chart above displays proportions of respondents reporting various political affiliations. There is substantial monthly variation in political affiliation in survey participants, as is the case for all socio-demographic characteristics. However, overall proportions of reported party affiliation are relatively stable over the years, which indicates that time trends in consumer sentiment or economic views are not an artifact of shifts in nonresponse on this dimension. Proportions of the three political groups in 2025 are generally within the historical ranges seen since 2017.
Moreover, unlike demographic characteristics like birth cohort that are fixed over time, political affiliation is a malleable characteristic of the national population and even individuals. Our rotating panel design—with re-interviews six and twelve months following the initial interview—allows us to see how a consumer’s self-reported political affiliation changes over time. Re-interviews in 2025 reveal that about 20% of consumers are changing their self-reported political affiliation between interviews, consistent with findings from other major national surveys. Political affiliation is not elicited until the very end of the interview, so respondents are not primed to think specifically about politics or partisanship prior to questions about economic sentiment or expectations. Rather, responses to political identification questions may reflect a sense of alignment with a party’s approach to economic issues, which itself changes over time as well. Thus, we should not expect “true” political shares in the underlying population to be fixed over time.
Overall partisan differences in economic perceptions and expectations may be large, but monthly trends in sentiment across time are unlikely to be distorted by differential survey completion by political affiliation, or to be merely an artifact of partisan differences in views. Instead, national trends capture meaningful changes in overall consumer views of the
economy.
Why might there have been a drop in Republican/lean Republican identification in April? Gee, maybe “Liberation Day” and the collapse in economic sentiment had something to do with it.
Finally, I’ll note that Joanne Hsu, Director of the Center, and the author of the quoted report, is not a professor (and pretty sure not a Marxist in the classical sense of an adherent to the labor theory of value, capital as congealed labor value, the inevitability of declining profitability of capital, etc.), and previously served as an economist with the Federal Reserve Board.
Addendum:
When is Dr. Antoni going to declare the end of the recession he and St. Onge declared started in 2022?