From Bloomberg:
The October jobs and consumer price index reports are unlikely to be released due to the government shutdown, White House Press Secretary Karoline Leavitt said Wednesday.
…
…
Leavitt didn’t clarify whether she was referring to the entire jobs report or just part of it. The report is composed of two surveys — one of businesses, which produces the main payrolls number, and another of households, which is responsible for the unemployment rate. While many businesses retain their records and report the data themselves electronically, reaching workers over the phone and asking them to recall their employment status for a particular week in October will be more difficult to conduct retroactively.
Article continues:
Leavitt expressed concern that the lack of data is “leaving our policymakers at the Fed flying blind at a critical period.” Federal Reserve officials next meet Dec. 9-10 to decide whether to lower interest rates for a third time this year.
I would speculate that the Administration is actually quite happy to not have any October employment numbers out, given likely outcomes on NFP, i.e., a negative growth reading (shown below). After all, the demolition of the White House East Wing was somehow deemed “essential”.
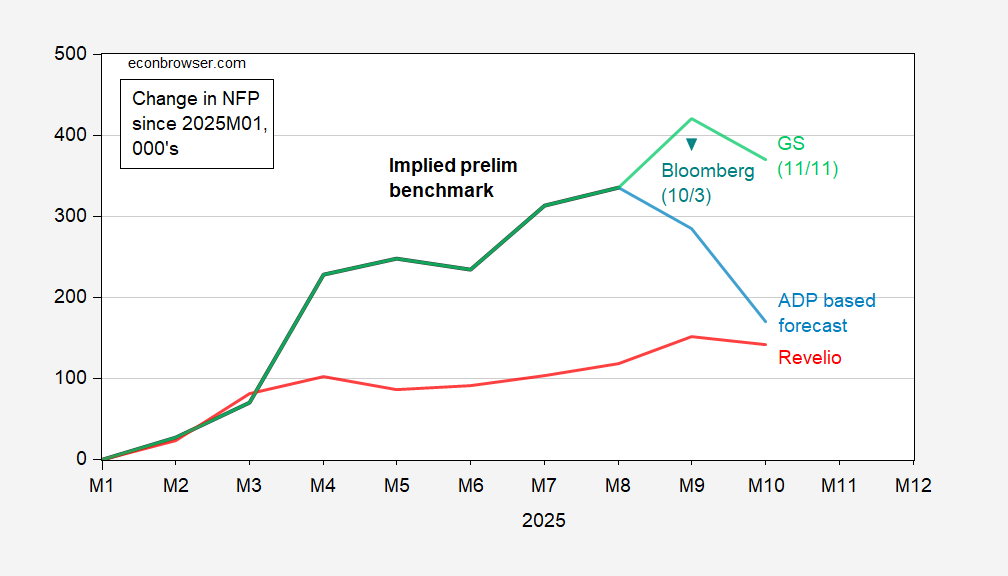
Figure 1: Implied preliminary benchmark revision nonfarm payroll series (bold black), forecast based on ADP private NFP (light blue), Bloomberg consensus of 10/3 (teal inverted triangle), Goldman Sachs (light green), and Revelio estimate (red), all in 000’s, s.a. Source: BLS, ADP, Bloomberg, Goldman Sachs (11/11), Revelio Labs (11/6), and author’s calculations.
No October CPI release, well then we’ll have to use Cleveland Fed nowcasts (as well as for PCE deflator for September and October):
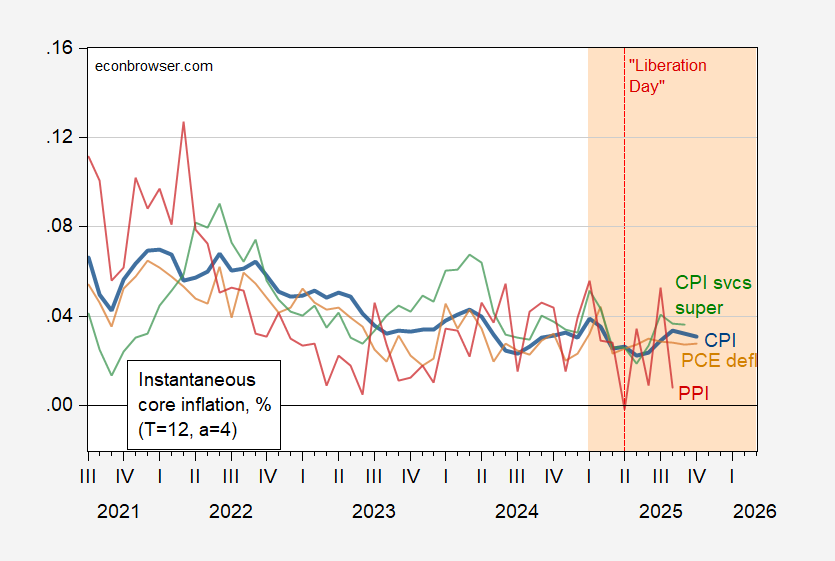
Figure 2: Instantaneous inflation for core CPI (bold blue), core PCE deflator (tan), services supercore CPI (green), PPI core (red), per Eeckhout (2023), T=12, a=4. CPI for October is nowcast of 11/11. PCE deflator for September and October observations is Cleveland Fed nowcast of 11/11. Source: BLS, BEA via FRED, Cleveland Fed, Paweł Skrzypczyński, and author’s calculations. \
Given current discussion of “affordability”, the Administration is happy to obscure any information regarding “groceries”. Last reading from September release is here:
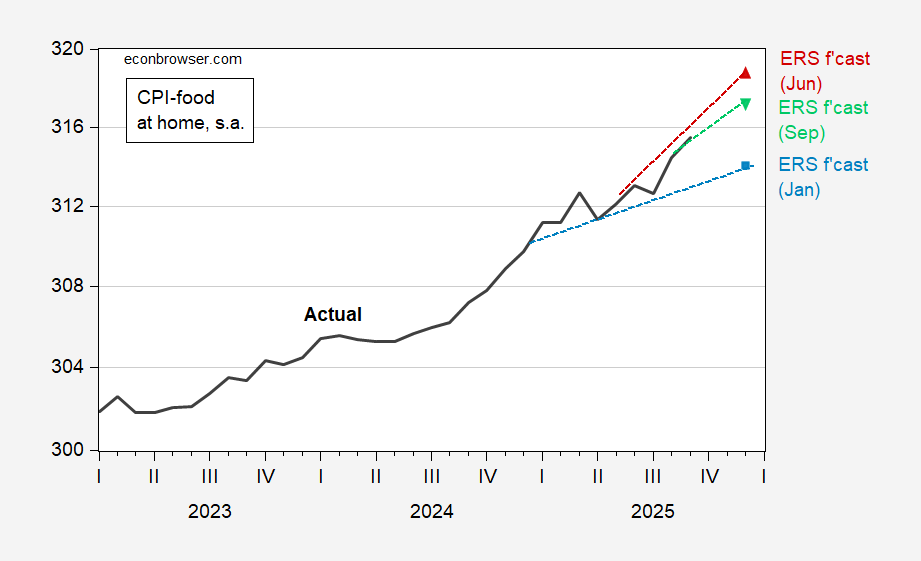
Figure 3: CPI food-at-home (black); ERS forecast of January (light blue square), ERS forecast of June (red triangle), ERS forecast of September (inverted green triangle), all on log scale. Source: BLS via FRED, ERS, and author’s calculations.
Finally, what insights do we have from the nowcast for CPI, relative to “groceries”, “fast food”, and “every-day prices”? Here’re prices relative to 2025M01:
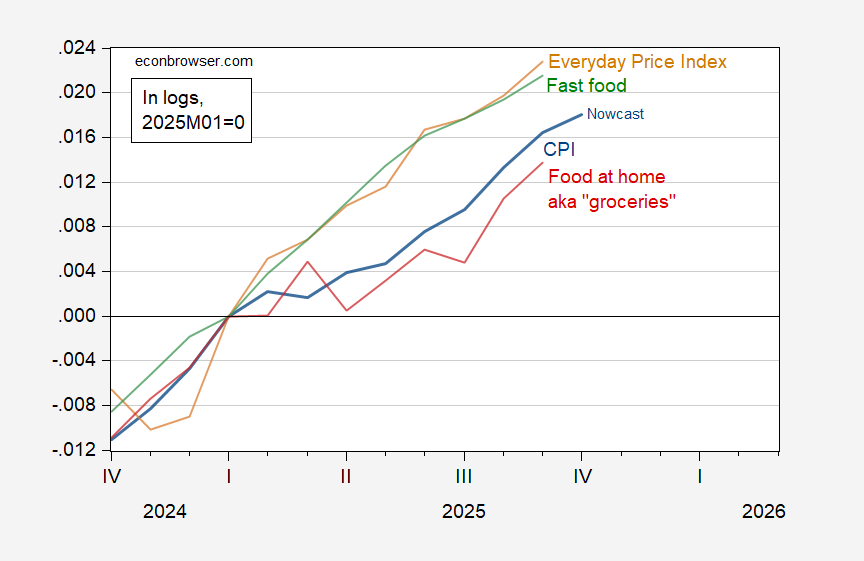
Figure 4: CPI all urban (blue), Everyday Price Index (tan), CPI for limited service restaurants (green), and CPI for food at home (red), all in logs, 2025M01=0. CPI for limited service restaurants seasonally adjusted by author using X-13. October CPI all urban is Cleveland Fed nowcast of 11/11. Source: BLS, AIER, Cleveland Fed, and author’s calculations.
I sincerely doubt that food prices came down in October, given momentum in such prices, the ERS forecast, and correlation with overall CPI.
Assuming all the standard government economic data series resume publication in coming months and that they remain reliable, we’ll be able to interpolate to fill the gaps without a great loss of information. There will, of coirse, be seasonal adjustment problems for few years and so quibblers will have one more thing to quibble about.
Either of the above assumptions could, of course, turn out not to be true.