Employment seems to be growing very slowly, if not shrinking, while output (measured with lots of noise) seems to be rising, into Q3. Would NBER ever determine a recession occurred when GDP was rising?
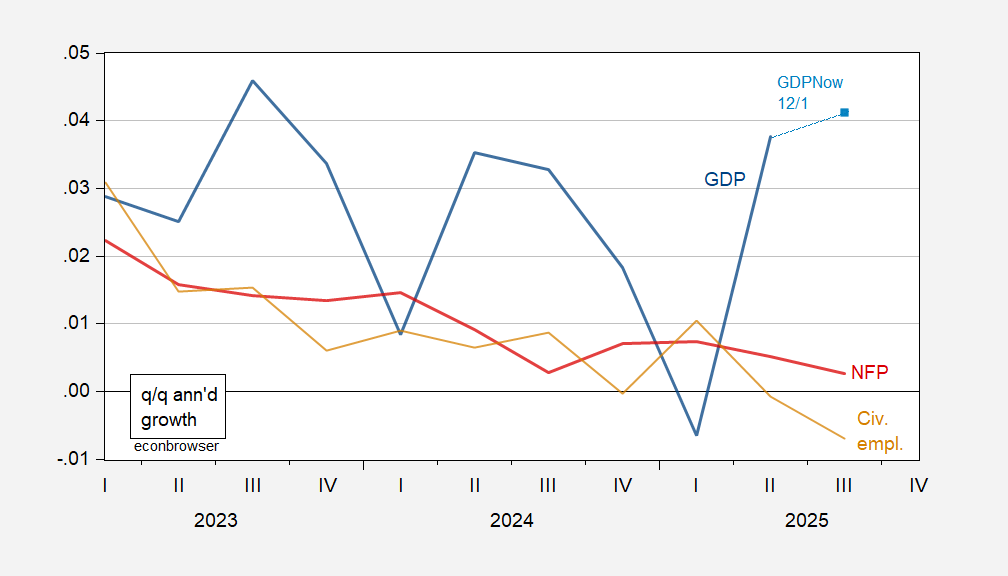
Figure 1: Quarter on Quarter annualized growth rate of GDP (bold blue), GDPNow (light blue square), nonfarm payroll employment implied preliminary benchmark (red), and civilian employment experimental series with smoothed population controls. (tan). Employment data is quarterly average of monthly data Source: BEA, Atlanta Fed, BLS via FRED, BLS, and author’s calculations.
There are instances of NBER recession dates encompassing both negative NFP employment and positive GDP growth, and vice versa. Usually, former is during periods in the middle of, or latter end of recessions. In the 2001 recession, there is only one quarter of negative GDP growth during the recession dates (and one quarter during the peak quarter), and not two consecutive quarters of negative GDP growth (so much for the two quarter rule!). However, there are three consecutive quarters of negative employment growth, encompassing peak-to-trough.
At the monthly frequency (going back to 1992 using Macroeconomic Advisers/SPGMI series), one finds the 2008-09 recession has NFP employment growth negative from 2008M01 onward, while monthly GDP growth is negative in 2008M02, and then 2008M07 onward.
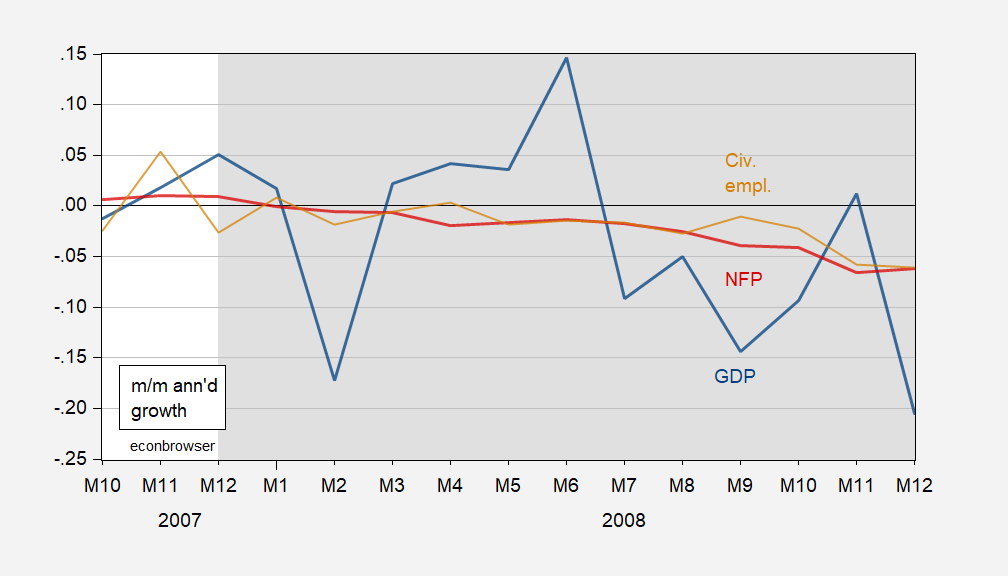
Figure 2: Month-on-Month annualized growth rate of monthly GDP (bold blue), nonfarm payroll employment implied preliminary benchmark (red), and civilian employment (tan). NBER peak-to-trough recession dates shaded gray. Source: BLS via FRED, S&P Global Market Insights (nee Macroeconomic Advisers, IHS Markit) (9/2/2025 release), and author’s calculations.
What’s the picture look like today?
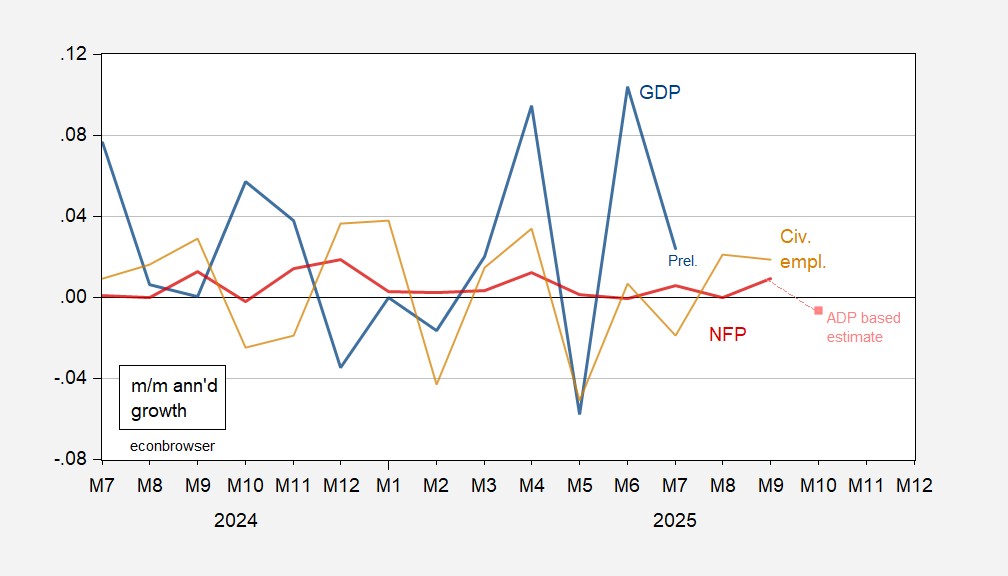
Figure 3: Month-on-Month annualized growth rate of monthly GDP (bold blue), nonfarm payroll employment, implied preliminary benchmark (red), nowcasted NFP (pink square), and civilian employment (tan). Source: BLS via FRED, S&P Global Market Insights (nee Macroeconomic Advisers, IHS Markit) (9/2/2025 release), and author’s calculations.
I estimate the level of nonfarm payroll employment for October using ADP’s private nonfarm payroll (NFP) employment to estimate BLS private NFP, and then add 22K (September government employment growth) and subtract 150K (for Deferred Furlough Program).
Nonfarm payroll employment and civilian employment have both been bouncing around zero (annualized) growth, while monthly GDP growth has been volatile. Of these indicators, the NBER’s Business Cycle Dating Committee places highest weight on employment and personal income ex-transfers. So, it could well be that we’re in a recession now, focusing on employment indicators, but we won’t know for a long time (and we’ll have only a little inkling come early December, for October NFP).
Notably, real final sales to domestic purchasers didn’t fall in any quarter of the 2001 recession:
https://fred.stlouisfed.org/graph/?g=1OnjI
Last time that happened was in the 1960s.
Back to modern times, the government shutdown makes at least one quarter of declining real GDP likely, specifically the current quarter. Only one quarter of decline, though, as the snap back in spending will add considerably to growth in Q1 of next year, making 2 consecutive quarters of decline unlikely. From the Hutchins Center:
“We expect fiscal policy to lower GDP growth by 1.4 percentage points in the fourth quarter of 2025, largely reflecting the temporary effects of the government shutdown, which we assume will reduce real GDP in the quarter by 1.5 percentage points. Fiscal policy is projected to boost GDP growth by about 2.7 percentage points in the first quarter of 2026, as the government reopens and delayed federal spending resumes.”
https://www.brookings.edu/articles/hutchins-center-fiscal-impact-measure/
This government spending wobble makes overall GDP problematic for determining whether recession is underway. It also makes GDP problematic as a guide for monetary policy. We can expect minions of the felon-in-chief to howl for rate cuts when Q4 GDP is reported, maybe even earlier, in response to forecasts for Q4. “Look how weak! Biden’s fault! We must do something!” Never mind that we already have reason to expect a rebound in Q1, well before the expansionary effects of monetary policy would be felt.
There may be a demographic element to that. If the population is growing, per capita spending may shrink while overall spending grows marginally. With the deportations and other disruptions, that isn’t going to happen this time. All we can be sure of is that the current administration will try to blame somebody else and will mishandle everything as badly as it can be mishandled.
in a bit of irony, the government shutdown probably makes it harder for two consecutive drops in gdp, thus by strict definition a recession will not occur. this will be a tricky call for a recession or not. and trump will obviously be angling for his benefit here. rate cuts while help ensure this outcome.
What if instead of GDP we look at private final (ex-invetories) domestic demand? Maybe we should also look to episodes when employment has fallen but we had no recession. I have a hard time imaging a recession in a scenario of increasing productivity and very easing financial conditions.
Daniel, I have linked to real finalsales to domestic purchasersin a comment above. Here’s non-farm employment:
https://fred.stlouisfed.org/graph/?g=1OoeT
As you’ll note, employment always falls during recession, and often continues to fall for a while afterward. That’s just how the NBER business cycle folks see things.
“All models are wrong, but some are useful”, Why are we modeling the data, what do we hope it will tell us?
If a recession is just a poor business environment, with businesses unable to find enough customers and/or readily-available capital to continue to profit, do we care about the businesses themselves or what a positive business environment provides? (normally more jobs, income, and opportunities to people) If those businesses aren’t providing that to the general public anymore, is GDP still useful in the same way?
If profitability has decoupled from also providing a high standard of living, is the analysis now unable to tell us much about the collective prospects of our country or is it just another tool to analyze if the line will go up?
GDP is one among many measures of economic activity. It it typically moves with employment (or hours worked), but now does not. That change in behavior provides information. If profits don’t assure a high standard of living across the income distribution, that’s also worth knowing.
There is a desire for heuristics, and that’s understandable. Nobody has the capacity to understand every subject in depth. Give most folks a single measure that serves as a barometer of economic health and they’re happy; they can move on to other things. When the usefulness of that barometer is called into question, it’s annoying.
For some folks, though, heuristics aren’t enough. The fact that overall output appears to be rising while the largest input is stalled is quite interesting, worth looking into.
We went through this with the Phillips curve a while back; unemployment was no longer predictive of inflation. “The Phillips curve is dead!” was all over the financial press. The Phillips curve was, in fact, telling us something really important about the inflationary environment. All you had to do was think about it for a couple of minutes. Same with the yield curve. It was the single most reliable recession predictor we had until recently, but failed (we think) in the early 2020s. Why it failed is worth knowing,notjust as a matter of curiosity, but because of what it tells us about the interaction of i terest rates, policy and the economy.
Kuznets himself argued (around the year 1934) that GDP should not always be used as a measure of welfare. A wise bird in my RSS feed told me that in late November.
Off topic – Special election in Tennessee 7th, because I can’t help myself:
Today is election day in Tennessee’s 7th Congressional District. Polls show Republican Epps ahead of Democrat Behn by about 2 points. Trump won this District by 22 points in 2024. The number being talked about as the good/bad threshold forRepublicans is 5 points, for no obvious reason. The previous holder of this seat, Republican Mark Green, won by a 20 point margin in both of his elections in the 7th District’s current configuration.
The press, which loves a horse race, points out that Democrats have routinely outperformed their polling results in this year’s elections, as if that’s a reliable predictor of anything. Anything less than a 20 point margin for Epps is a sign that Republicans are slipping.