Today, we’re fortunate to have Willem Thorbecke, Senior Fellow at Japan’s Research Institute of Economy, Trade and Industry (RIETI) as a guest contributor. The views expressed represent those of the author himself, and do not necessarily represent those of RIETI, or any other institutions the author is affiliated with.
The U.S. public debt equals $38 trillion. In fiscal year 2025 the government paid almost $1 trillion in interest on the federal debt. This is more than the government spent on defense. Interest payments on the debt have more than doubled since 2021.
The Risk Characteristics of Treasury Bonds
Interest rates on Treasury bonds depend on their risk characteristics. Finance theory teaches that an asset’s riskiness depends on its correlation with the stochastic discount factor (SDF). Assets with high negative correlations with the SDF pay less at risky times when the SDF is high. To compensate for this risk they must pay higher expected returns. Stocks have negative correlations with the SDF and thus have to offer higher expected payoffs. Campbell et al. (2025) treated the correlation of other assets with stocks as a proxy for their correlation with the SDF. So if bonds covary positively with stocks they are riskier and must offer higher interest rates.
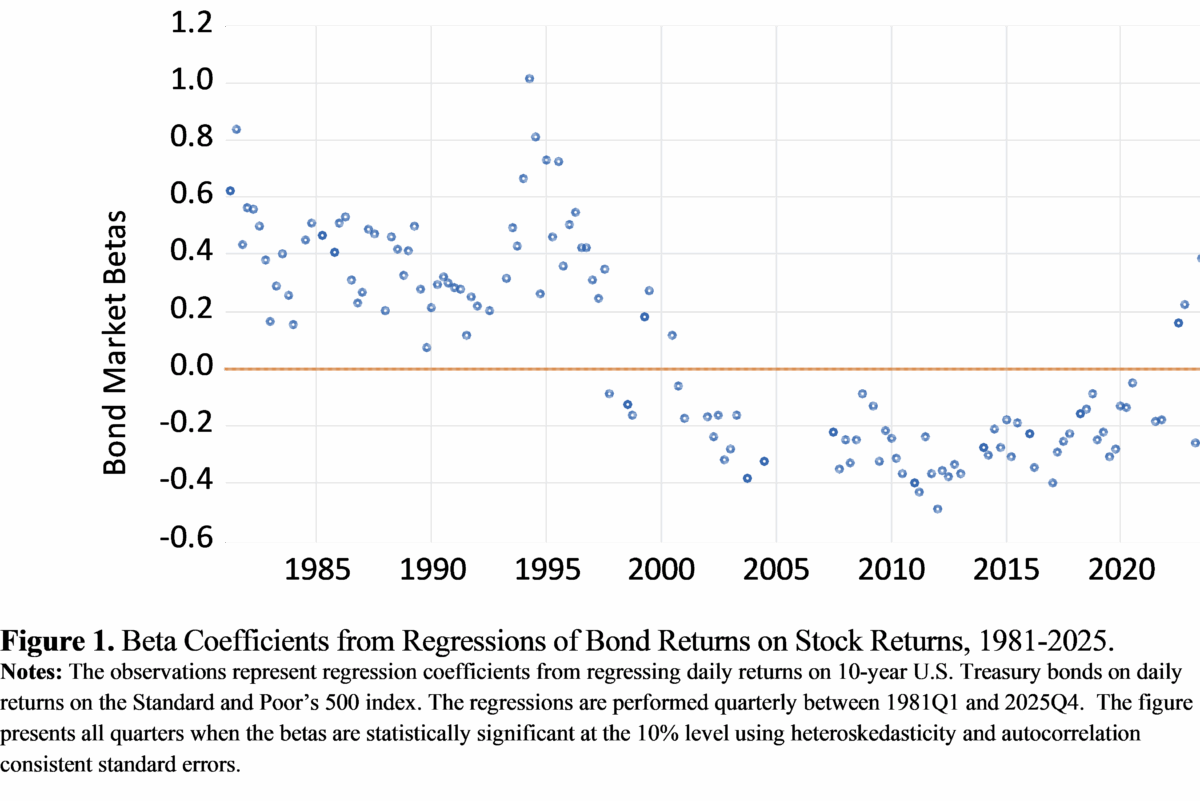
Following Campbell et al. (2025), we can investigate bond-stock comovements by regressing returns on long-term Treasury bonds on returns on the aggregate U.S. stock market. Figure 1 presents the results of regressing returns on 10-year Treasury securities on returns on the Standard and Poor’s 500 stock market index. The estimation is performed using daily data over 90-day windows between 1981 and 2025. The figure presents all of the quarters when the betas are statistically significant at at least the 10% level. Bond-stock comovements are largely positive during the 1980s and 1990s. They then became negative around the turn of the century. They remained negative until the third quarter of 2022. They turned positive again between 2022Q3 and 2024Q2.
Pflueger (2025) investigated the causes of bond-stock comovements using a New Keynesian model. She calibrated the model over two periods, one centered around the 1980s and the other after 2000. In the first period, supply shocks were volatile and monetary policy aggressively resisted inflation. In the second period, demand shocks dominated, supply shocks were secondary, and the monetary policy rule assigned less weight to fighting inflation. Consistent with historical experience, her model generated positive bond-stock comovements during the first period and negative comovements during the second period.
Pflueger (2025) also ran a counterfactual scenario to try to obtain positive bond-stock comovements using the calibration from the 2000s. She reported that supply shock volatility is necessary but not sufficient to generate large positive bond-stock betas such as occurred in the 1980s. Monetary policy must also assign a high weight to inflation. Intuitively, if monetary policymakers discount inflation and allow real interest rates to decrease following a negative supply shock, the economy will avoid a recession. Thus, while bond prices fall due to inflation, stock prices do not fall because monetary policy cushions the output decline. On the other hand, if monetary policymakers are hawkish, higher inflation due to an adverse supply shock will be accompanied by higher real interest rates and a decrease in output. The higher inflation reduces bond returns and the decline in output reduces stock returns. Thus stock and bond prices will move together.
Figure 1 shows that, in addition to the positive correlations in the 1980s and the negative correlations in the 2000s that Pflueger (2025) investigated, bond-stock betas were positive and large in 1994 and 1995. They were also positive between 2022Q3 and 2024Q2. The 1994-1995 period was a time when contractionary monetary policy roiled the bond market (see Campbell, 1995). The 2022-2024 period was a time when the Russia-Ukraine war, expansionary fiscal and monetary policy, and other factors pushed inflation to a 40-year high. The Fed then responded by aggressively tightening policy. These episodes highlight how inflationary shocks and anti-inflationary monetary policy can generate positive bond-stock comovements.
Investigating Bond-Stock Comovements Beginning in the 1960s
Campbell et al. (2025), Pflueger (2025), and others investigated bond-stock comovements beginning in the 1970s. One reason for the start date is that data on 10-year zero coupon Treasury yields are available from Gürkaynak et al. (2007) beginning in the 1970s. In the 1970s bond-stock comovements were positive, implying that bonds were risky. Thorbecke (2026) examined these comovements beginning in the 1960s. In the 1960s Treasury bonds were considered safe, assets of choice for widows and orphans.
Data on 7-year zero coupon Treasury yields are available from Gürkaynak et al. (2007) beginning in the 1960s. These 7-year yields are closely related to 10-year yields. Regressing the change in the 7-year yield on the change in the 10-year yield over the August 1971 to November 2025 period gives a coefficient of 0.99 and a t-statistic of 455.
Figure 2 presents the results of regressing returns on 7-year Treasury securities on returns on the Standard and Poor’s 500 stock market index. The estimation is performed using daily data over 90-day windows between 1964 and 1980. The figure presents all of the quarters when the betas are statistically significant at at least the 10% level.
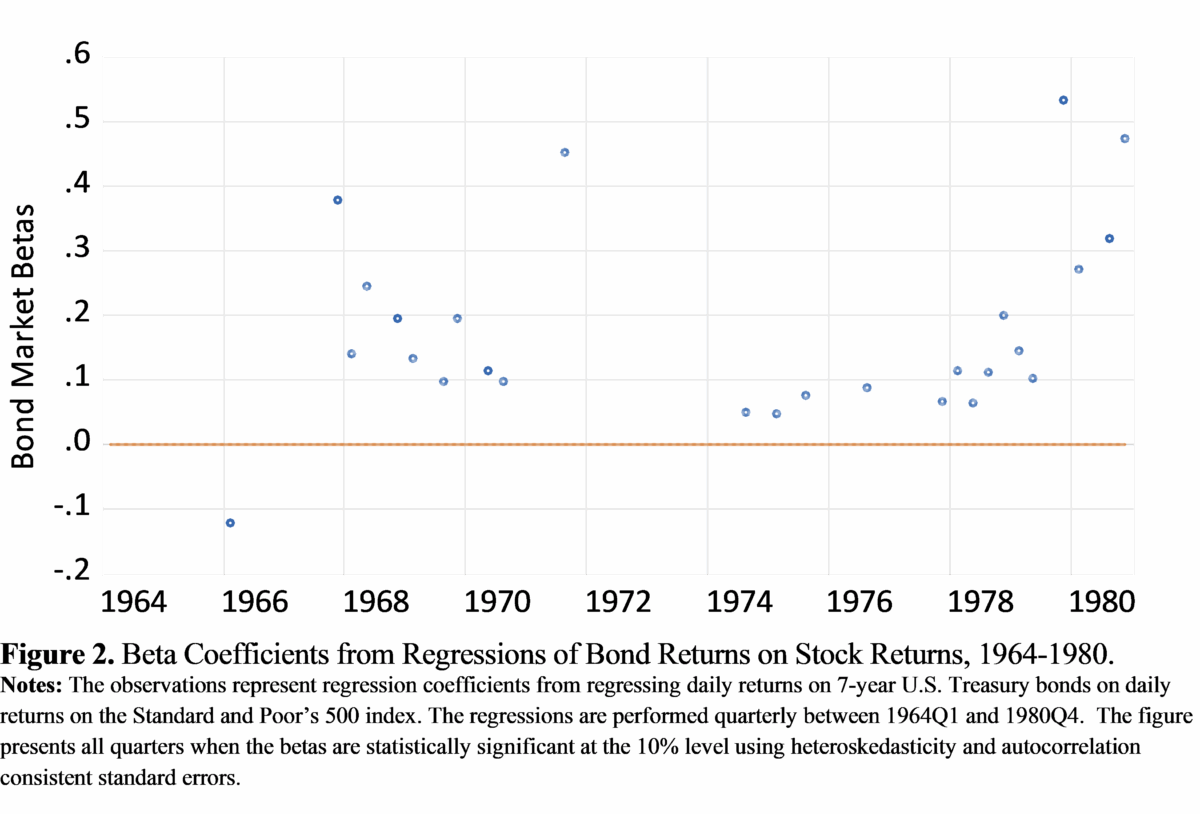
Between 1964Q1 and 1967Q3 the betas are never positive and statistically significant. The beta is negative and statistically significant in 1966Q1. Betas then become positive and significant beginning in 1967Q4. Between 1967Q4 and 1971Q3 betas are positive and statistically significant in 10 of the 16 quarters.
Understanding Bond-Stock Comovements in the 1960s and 1970s
While few adverse supply shocks hit the U.S. economy in the late 1960s, President Johnson in 1968 ran the highest budget deficit in over twenty years. The Federal Reserve at this time viewed these deficits as inflationary. The consumer price index (CPI) inflation rate rose from 3% in 1967 to 5.5% in 1969 to 6% in 1970. The Fed, after getting behind the curve, aggressively fought inflation from the end of 1967 to the end of 1969. The late 1960s thus contained the combination of inflationary shocks and anti-inflationary monetary policy that Pflueger (2025) found was necessary to produce positive bond-stock comovements.
There are no statistically significant betas in Figure 2 between 1971Q4 and 1974Q2. Inflationary shocks arrived in spades at this time. Grain prices soared as the U.S. government arranged the largest grain sale in history to the Soviet Union. The dollar depreciated 20% between August 1971 and July 1973, raising import prices. Poor anchovy catches in Peru forced feedstock makers to replace anchovies with soybeans. This combined with flooding in the Midwest raised soybean prices. Food price inflation equaled 17% in 1973.
Despite rising inflation, Fed policy remained expansionary. Fed Chairman Arthur Burns believed that the wage and price controls that President Nixon implemented would contain inflation (Pierce, 1979). Burns focused instead on stimulating the economy.
Oil prices then quadrupled between October 1973 and March 1974. The CPI inflation rate in 1974 exceeded 11%. The Fed in 1974 implemented tight monetary policy to fight inflation. The combination of inflationary shocks and hawkish monetary policy is associated with the positive betas beginning in 1974.
A second oil price shock arrived in 1979. It was precipitated by the Iranian Revolution and reinforced by the Iran-Iraq War. The overall inflation rate in 1980 approached 14%. Fed Chairman Paul Volcker then declared war on inflation. The betas in Figure 2 are large in 1979 and 1980.
Thorbecke (2026) reported vector autoregression evidence indicating that monetary policy contributed to positive bond-stock comovements beginning in the 1967-71 period and extending over the next 15 years. Evidence from a cross-section of asset returns also indicates that both monetary policy shocks and inflationary shocks drove bond and stock prices in the same direction at this time.
Lessons for the Present
Evidence beginning in the 1960s confirms what Pflueger (2025) found for later periods. At both times inflationary shocks combined with hawkish monetary policy generated positive bond-stock comovements. The U.S. government should be careful now to not stimulate inflation, whether through tariffs, budget deficits, or other factors. The Fed should also not permit inflation to accelerate as this would require aggressive policy later. Otherwise, the government and the Fed risk making Treasury bonds even riskier assets than they are now. This would raise interest rates and multiply Federal debt service expenditures that already equal 1 trillion dollars per year.
References
Campbell, J.Y. 1995. Some Lessons from the Yield Curve. Journal of Economic Perspectives, 9, 129–152.
Campbell, J.Y., Pflueger, C., and Viceira, L. 2025. Bond-Stock Comovements. NBER Working Paper 34323. Cambridge, MA: National Bureau of Economic Research.
Gürkaynak, R., Sack, B., and Wright, J. 2007. The U.S. Treasury yield curve: 1961 to the present. Journal of Monetary Economics, 54, 2291-2304.
Pflueger, C. 2025. Back to the 1980s or not? The Drivers of Inflation and Real Risks in Treasury Bonds. Journal of Financial Economics, 167, Article Number 104027.
Pierce, J. 1979. The Political Economy of Arthur Burns. Journal of Finance, 34, 485-496.
Thorbecke, W. 2026. Bond-stock Price Comovements: Evidence from the 1960s to the 1990s RIETI Discussion Paper 26-E-011. Tokyo: Research Institute of Economy, Trade and Industry.
This post written by WIllem Thorbecke.
Excellent and common-sensical, which means non-specialists have reason tomemorize it.
One quibble:
“Fed Chairman Arthur Burns believed…”
I shy away from claiming that I know what people believe, especially those in public life. In this case, we know Nixon pressured Burns to keep rates low, which is reason to suspect a gap between what Burns said and what he believed. We have a non-accusatory alternative in “Burns maintained…” i’d go with that.
As you can imagine, this is not the first time someone has looked for a systemic correlation. The late Jeff Miller of NewArc Investments, and according to his biography once a professor at Wisconsin, highlighted a similar graph in this article 10 years ago (discussion is about 3/4’s of the way to the end of the article).
https://www.advisorperspectives.com/commentaries/2016/10/11/weighing-the-week-ahead-is-this-the-end-of-the-earnings-recession?firm=newarc-investments-inc
The specific discussion with excellent accompanying chart from JP Morgan for the period 1963-2016 concludes, “When yield are [above] below 5%, rising rates have historically been associated with rising [declining] stock prices.” (Words in brackets are mine)
He did not specify a reason why. I subsequently had a discussion with him on the point. My thesis was that when rates are low, the the primary fear in the markets is deflation in wages as well as prices. Above that level, the primary fear is inflation.
At the moment we are most likely transitioning from the former primary fear to the latter.