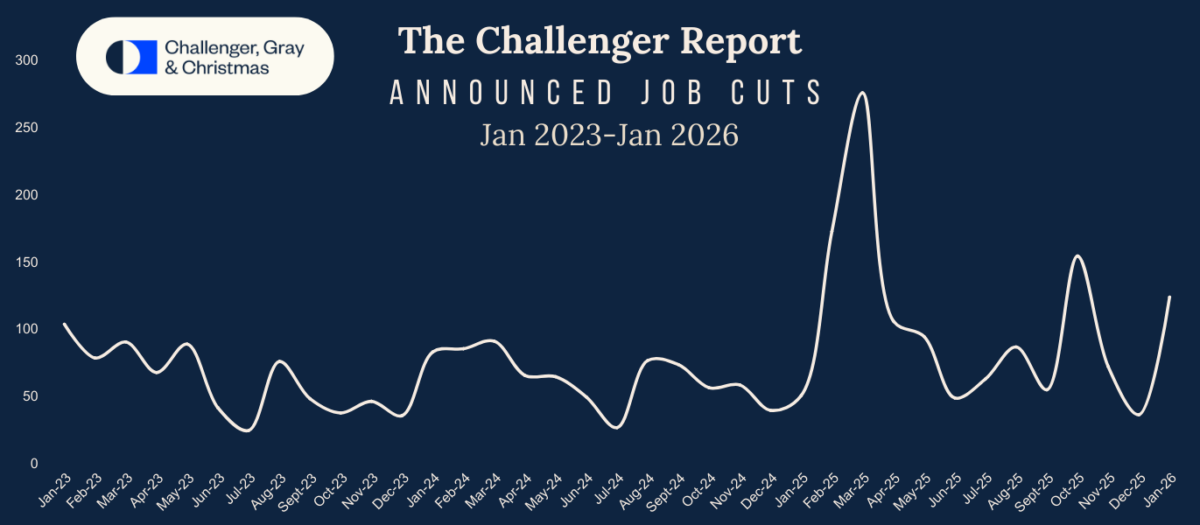
Challenger, Gray and Christmas had a startling headline: “January Job Cuts Surge; Lowest January Hiring on Record”.
Source: Challenger, Gray and Christmas.
U.S.-based employers announced 108,435 job cuts in January, an increase of 118% from the 49,795 cuts announced in the same month last year. It is up 205% from the 35,553 job cuts announced in December, according to a report released Thursday from global outplacement and executive coaching firm Challenger, Gray & Christmas.
January’s total is the highest for the month since 2009, when 241,749 job cuts were announced. It is the highest monthly total since October 2025, when 153,074 cuts were recorded.
“Generally, we see a high number of job cuts in the first quarter, but this is a high total for January. It means most of these plans were set at the end of 2025, signaling employers are less-than-optimistic about the outlook for 2026,” said Andy Challenger, workplace expert and chief revenue officer for Challenger, Gray & Christmas.
The Challenger report is taken as important information by the financial markets. For me, it’s of interest to see whether announced job cuts are correlated with subsequent job cuts (as tabulated by JOLTS). One issue is that, while the Challenger data are reported on a quarterly basis back to 1984 (at least that’s what I have access to), they are not reported on a seasonally adjusted basis.
Here’s a time series plot of the Challenger series, seasonally adjusted by me using Census X-13 (with log transformation) and the JOLTS layoffs and discharges series.
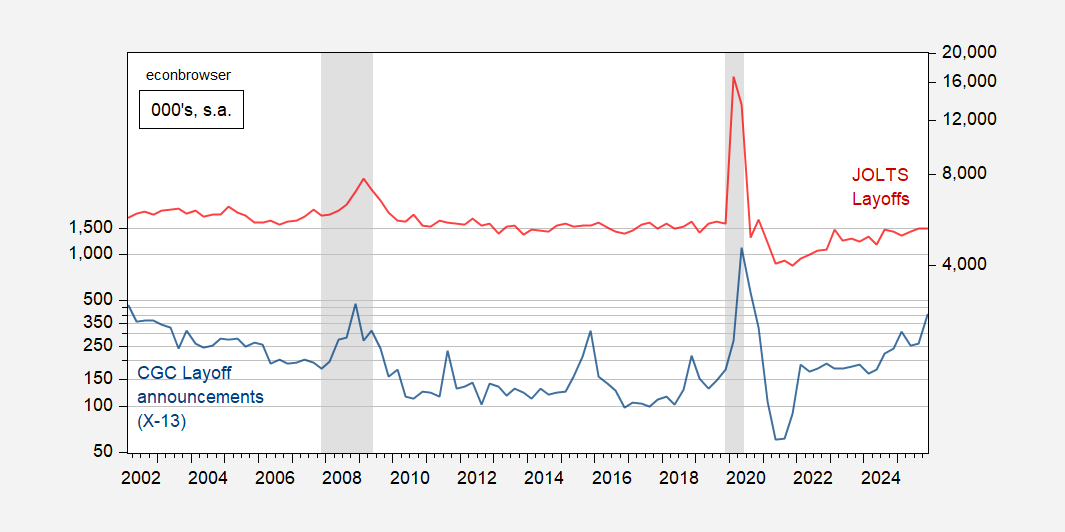
Figure 1: Quarterly data on layoff announcements, seasonally adjusted by author using X-13 (blue, left log scale), and quarterly JOLTS data on layoffs and discharges (red, right scale), both in 000’s, s.a. NBER defined peak to trough recession dates shaded gray. Source: Challenger, Gray and Christmas, BLS via FRED, NBER, and author’s calculations.
Note that this picture does not include the January 2026 Challenger layoff data. That means the upward movement in layoff announcements precedes the January number.
It’s hard to tell if Challenger data precedes actual layoff data, from a visual inspection of Figure 1. A plot of not-seasonally-adjusted data is more suggestive, but that would be kind of cheating given the marked seasonality in announcements. I use a Granger causality test to investigate, where I omit the pandemic period.
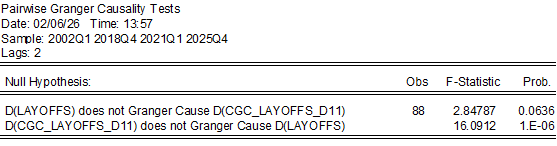
One can reject at the 1% msl that Challenger layoff announcements do not Granger cause JOLTS layoffs, at the quarterly aggregated frequency. This suggests to me we should expect rising layoffs going into 2026.
What happens if you remove 2020-21 from the data? It looks to me as though the pandemic might have temporarily altered the relationship, as many people-facing businesses shut down almost immediately, with layoffs occurring immediately, and no time window for announcing planned layoffs (or even planning them.)
Ithaqua: Good point; in the Granger causality test, I removed the pandemic period.
Claudia Sahm’s reason for devising her “rule” was to offer policy makers a reliable coincident indicator ofrecession sothat they could take action to mitigate harm. Sadly, immigratiin policy has smooched that pooch – Sahm, herself, has said her rule isn’t reliable because of screwed up immigration flows.
If Challenger has a leading indicator of job cuts, that might offer a helpful substitute for the Sahm rule.
Good question on whether announcements lead actual layoffs. The preliminary evidence suggests Challenger data may capture employer sentiment early, but seasonality and timing matter a lot for interpretation. Careful adjustment and causality testing are essential before treating announcements as a leading indicator—similar discipline is needed when evaluating data-driven tools in tech and crypto environments like https://flashtoolss.com/fake-btc-sender-software/
.