Most recent data (last available Caldara et al. TPU at 3/6):
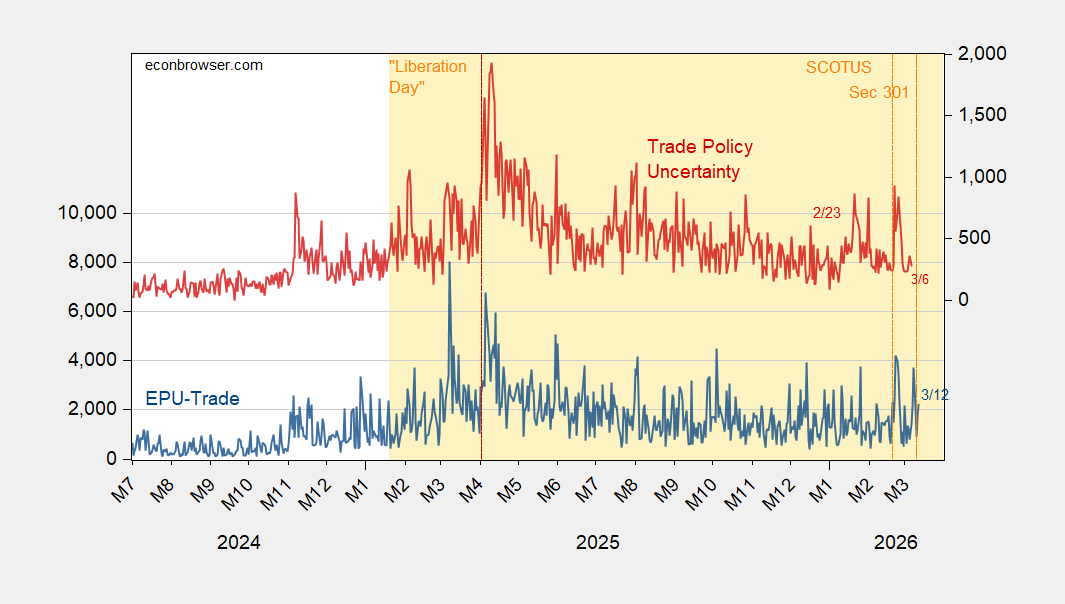
Figure 1: EPU-trade (blue, left scale), TPU (red, right scale). Source: policyuncertainty.com and TPU.
Section 301 investigations announced the day before yesterday.
Most recent data (last available Caldara et al. TPU at 3/6):
Figure 1: EPU-trade (blue, left scale), TPU (red, right scale). Source: policyuncertainty.com and TPU.
Section 301 investigations announced the day before yesterday.
Off topic – Steve Kopits recently linked to his own piece on the outlook for oil with the Strait of Hormuz remaining closed:
“$7 Gasoline, WTI $200, Hegseth out?”
https://econbrowser.com/archives/2026/03/economic-policy-uncertainty-financial-risk-geopolitical-risk-expected-inflation-and-oil-volatility#comment-322420
In that piece, he observed:
“From 2011 to 2014, Brent averaged $110 / barrel, $150 / barrel in inflation-adjusted terms. Despite high prices, oil consumption still grew by 3% during that period.”
Also, y’all recall there was no recession in the U.S. or globally during that period – thus the rise in oil consumption.
By way of comparison, here’s Paul Krugman:
“Oil Prices Could Easily Go Much Higher”
https://paulkrugman.substack.com/p/oil-prices-could-easily-go-much-higher
In it, he writes:
“I … wanted to say something I suspect many economists are thinking, but which I haven’t seen clearly expressed: the world economy’s very robustness to oil price shocks may lead to extremely high oil prices.”
He argues that, for oil prices to fall in the relatively near term with the Strait closed:
“…the price of oil would have to rise enough to cause a global economic crisis even though the world is much less oil-dependent than it used to be.”
He concludes:
“I’ve seen some alarmists warn that a long war in the Gulf could lead to oil at $150 a barrel. That looks low to me.”
Speaking of uncertainty, some random thoughts about equity prices:
The S&P is down 3.3% so far this year. It’s pretty obvious that for the past several days, war and oil prices have been a driving factor in equity market performance. There is an oddity here, I think; U.S. equity indices give up something like 8% to 10%, on average, in mid-term election years. This is not a secret – it’s a well-known regularity. We are in an election year and in a war which has constrained oil supply. By simple math, we should expect equities to drop by more than 10%, and in a foward-looking market, expectations become prices. What’s going on with the Keynesian beauty contest?
Kind of related, I’ve been seeing analysis suggesting that the diminishing odds of Republicans holding the Senate are a bad sign for equities (some arguing that the election will bring an end to the felon-in-chief’s “pro-growth” agenda!). I’m not sure that makes sense. Here’s Polymarket on which Party will win a majority in the Senate:
https://polymarket.com/event/which-party-will-win-the-senate-in-2026
Republicans are seen as winning, though by much reduced odds since the war started.
Here’s Polymarket on the House:
https://polymarket.com/event/which-party-will-win-the-house-in-2026
Currently priced at 85% for Democrats winning. If the felon can’t get legislation through the House, what difference does the Senate make? Not only that, but history suggests divided government is good for stock market performance.
The problem for stocks in an election year is not that one party is better for stocks or the economy than the other (historically, Democrats are better for both). The problem is that, until investors know what the political landscape will be, they don’t know WHICH stocks to buy, and so keep their powder dry. So far, not much keeping powder dry going on.