G.17 release today shows downward movement in industrial, manufacturing production (-0.5%, -0.1% vs. Bloomberg consensus +0.1% m/m). Industrial capacity utilization also below consensus.
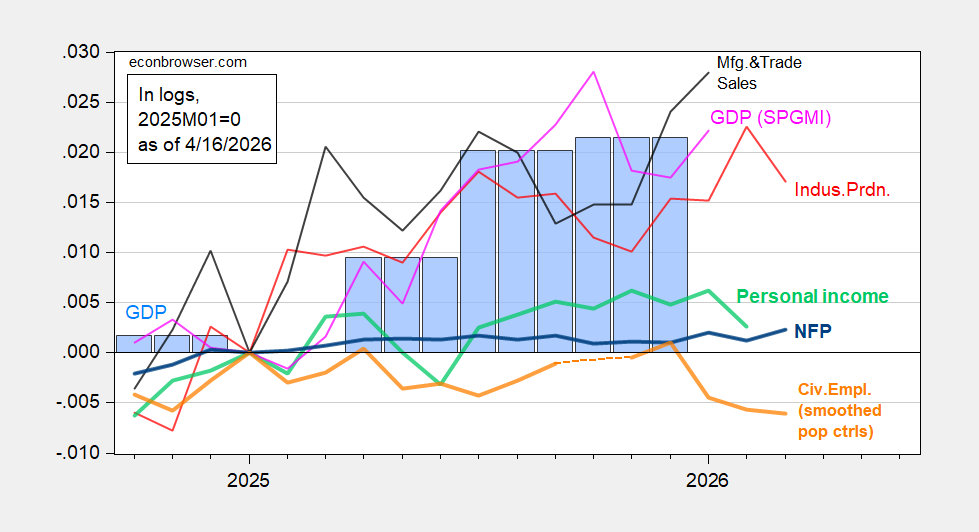
Figure 1: NFP employment (bold blue), civilian employment with smoothed population controls (bold orange), industrial production (red), personal income excluding current transfers in Ch.2017$ (bold light green), manufacturing and trade sales in Ch.2017$ (black), and monthly GDP in Ch.2017$ (pink), GDP (blue bars), all log normalized to 2025M01=0. Source: BLS via FRED, BLS, Federal Reserve, BEA 2025Q4 3rd release, S&P Global Market Insights (nee Macroeconomic Advisers, IHS Markit) (3/23/2026 release), and author’s calculations.
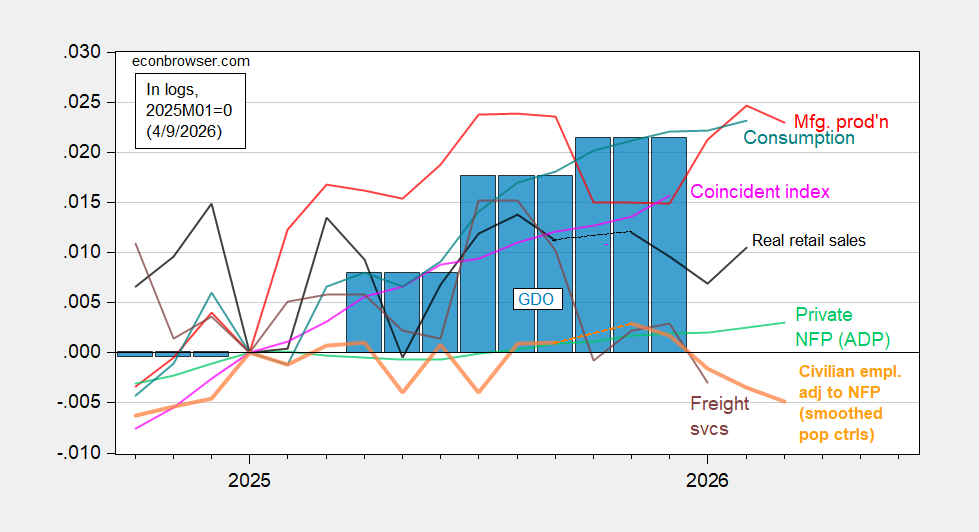
Figure 2: Civilian employment adjusted to NFP concept smoothed population controls (bold orange), manufacturing production (red), ADP private nonfarm payroll employment (light green), real retail sales, CPI deflated (black), freight services indexes (brown), and coincident index in Ch.2017$ (pink), GDO (blue bars), all log normalized to 2025M01=0. Source: BLS, ADP,via FRED, Philadelphia Fed [1], Philadelphia Fed [2], Bureau of Transportation Statistics, Federal Reserve via FRED, BEA 2025Q4 3rd release, and author’s calculations.
Figure 1 shows a dip in personal income less transfers. There is also, at least in the NY Fed District, a shift in the composition of personal income gains. Employers report offering smaller wage gains, 0.9 ppts smaller on average, because of the rising cost of health insurance for workers:
https://libertystreeteconomics.newyorkfed.org/2026/03/are-rising-employee-health-insurance-costs-dampening-wage-growth/
Rising insurance premia are driving a wedge between employers’ costs and workers’ take-home pay. Retail sales show the effect of weak growth in take-home pay. The divergence between retail sales and total consumption is getting progressively bigger, too. I need to know more about that.
I just want to reiterate that if you use August 2025 as your baseline rather than January, most of the monthly series above have been flat (no more than a 0.1% increase) to down. Only real manufacturing and trade sales, the utilities component of industrial production (read: AI data center construction and operation), and real spending on services (not goods) are meaningfully higher.
Aside from those, the only meaningful leading metrics for the economy that are positive are extremely low jobless claims and the stock market (which I suspect is also very much about AI).
An addition to your list:
https://www.newyorkfed.org/research/policy/cmdi#/interactive
Corporate bonds are showimg signs of stress. Notably, it is investment-grade credit that’s leading the rise in the NY Fed’s stress measure. There is probably some overlap between your point about AI being a big part of any good news in leading indicators and my point about credit stress.