Answer to Question 5 on Problem Set 4 in Public Affairs 854:
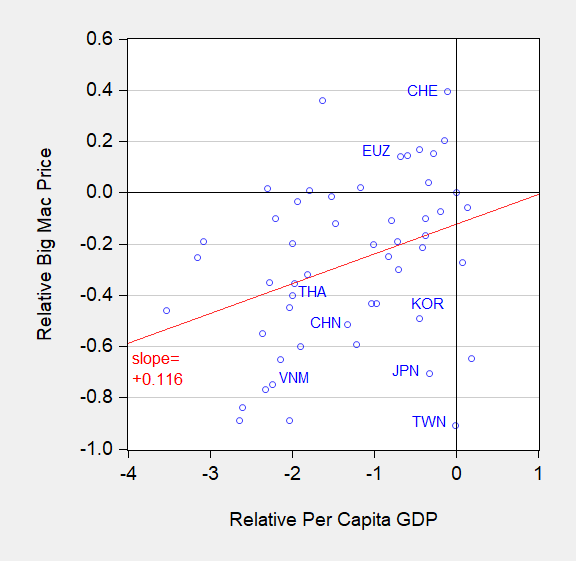
Figure 1: Log relative price of Big Mac (to US) vs. log relative per capita income (to US). Regression line (red). Source: Economist, January 2026, and author’s calculations.
I’ve identified the countries the Macroeconomic and Foreign Exchange Policies of Major Trading Partners of the United States listed as on the watch list. Germany and Ireland aren’t broken out in the BigMac database, so I list the Euro Area (EUZ) as a “country”.
Why would even try a linear regression on a cloud of random dots like this? I bet you can remove 3-4 data points and get a negative slope.
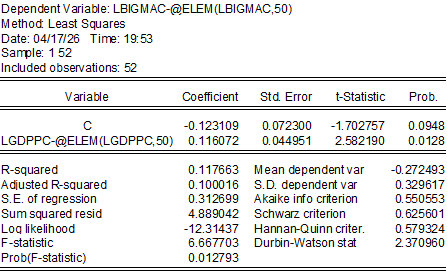
Optimistic but Sceptic: Having run this regression on cross-sections like this and panel regressions with this and Penn World Tables multiple times, I can tell you the regression line (log-log) is pretty robust. With a wide enough cross-section, certain types of tests will reject a linear specification with a inverted U shaped line. See Cheung, Chinn and Nong (2017), Cheung, Chinn and Fujii (2010), Cheung, Chinn and Fujii (2007), inter alia.